
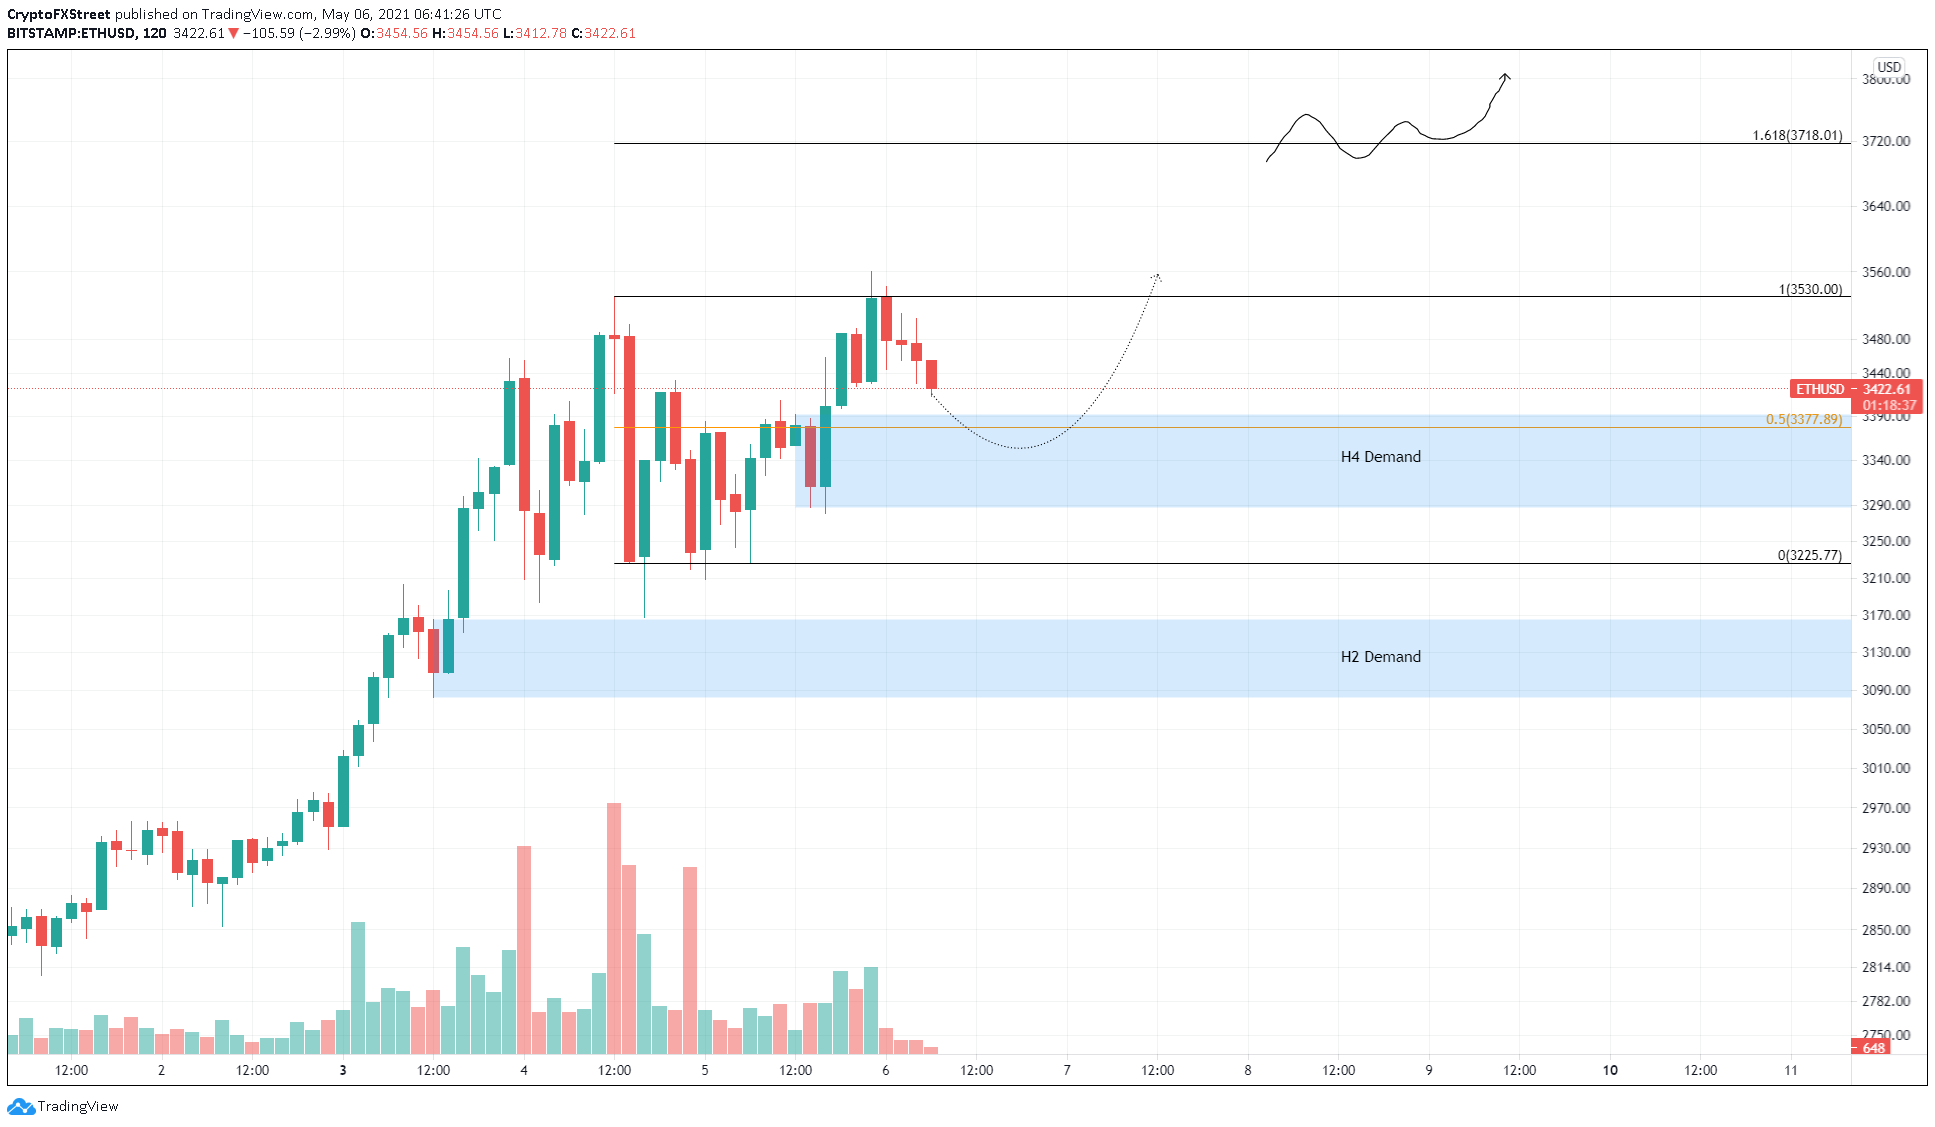
- Ethereum price shows a tight consolidation range in progress on the 4-hour chart.
- A minor retracement to the immediate demand barrier ranging from $3,287 to $3,392 seems likely.
- Multiple on-chain indicators show strengthening fundamentals adding a tailwind to the bullish thesis.
Ethereum price is tightly wound as its range-bound movement continues after setting up an all-time high on May 5. ETH might retest its swing low before surging higher and potentially rallying to new highs.
Ethereum price coils up
On the 4-hour chart, Ethereum price is trading in a range that extends from $3,225 to $3,530. As ETH slides lower, it could either bounce off the immediate support area that stretches from $3,287 to $3,392 or dip toward the swing low and even deviate below it.
However, this drop will help long-term holders accumulate ETH at a discount, providing a short-term boost in buying pressure and keeping ETH prices from falling.
Therefore, investors can expect the smart contract token to eventually bounce from this point to retest its ceiling at $3,559.
If the bullish momentum is enough, Ethereum price will shatter through the resistance level and surge roughly 5% to tag a new all-time high at $3,718, coinciding with the 161.8% Fibonacci retracement level.
ETH/USD 2-hour chart
Supporting this bullish outlook is the supply distribution chart, which shows that whales holding between 1,000,000 to 10,000,000 ETH have increased by 9% since April 19.
The addition of one new whale to this category indicates that these investors are optimistic about Ethereum price performance in the future.
-637558852295434144.png)
ETH supply distribution chart
Compounding the confidence in an upswing is a rapid decline in the number of ETH held by centralized entities from 22.1 million to 21.3 million in the past month. This 3.6% collapse further reduces the sell-side pressure that arises primarily from exchanges, providing a path of little-to-no resistance for a potential uptick in Ethereum price.
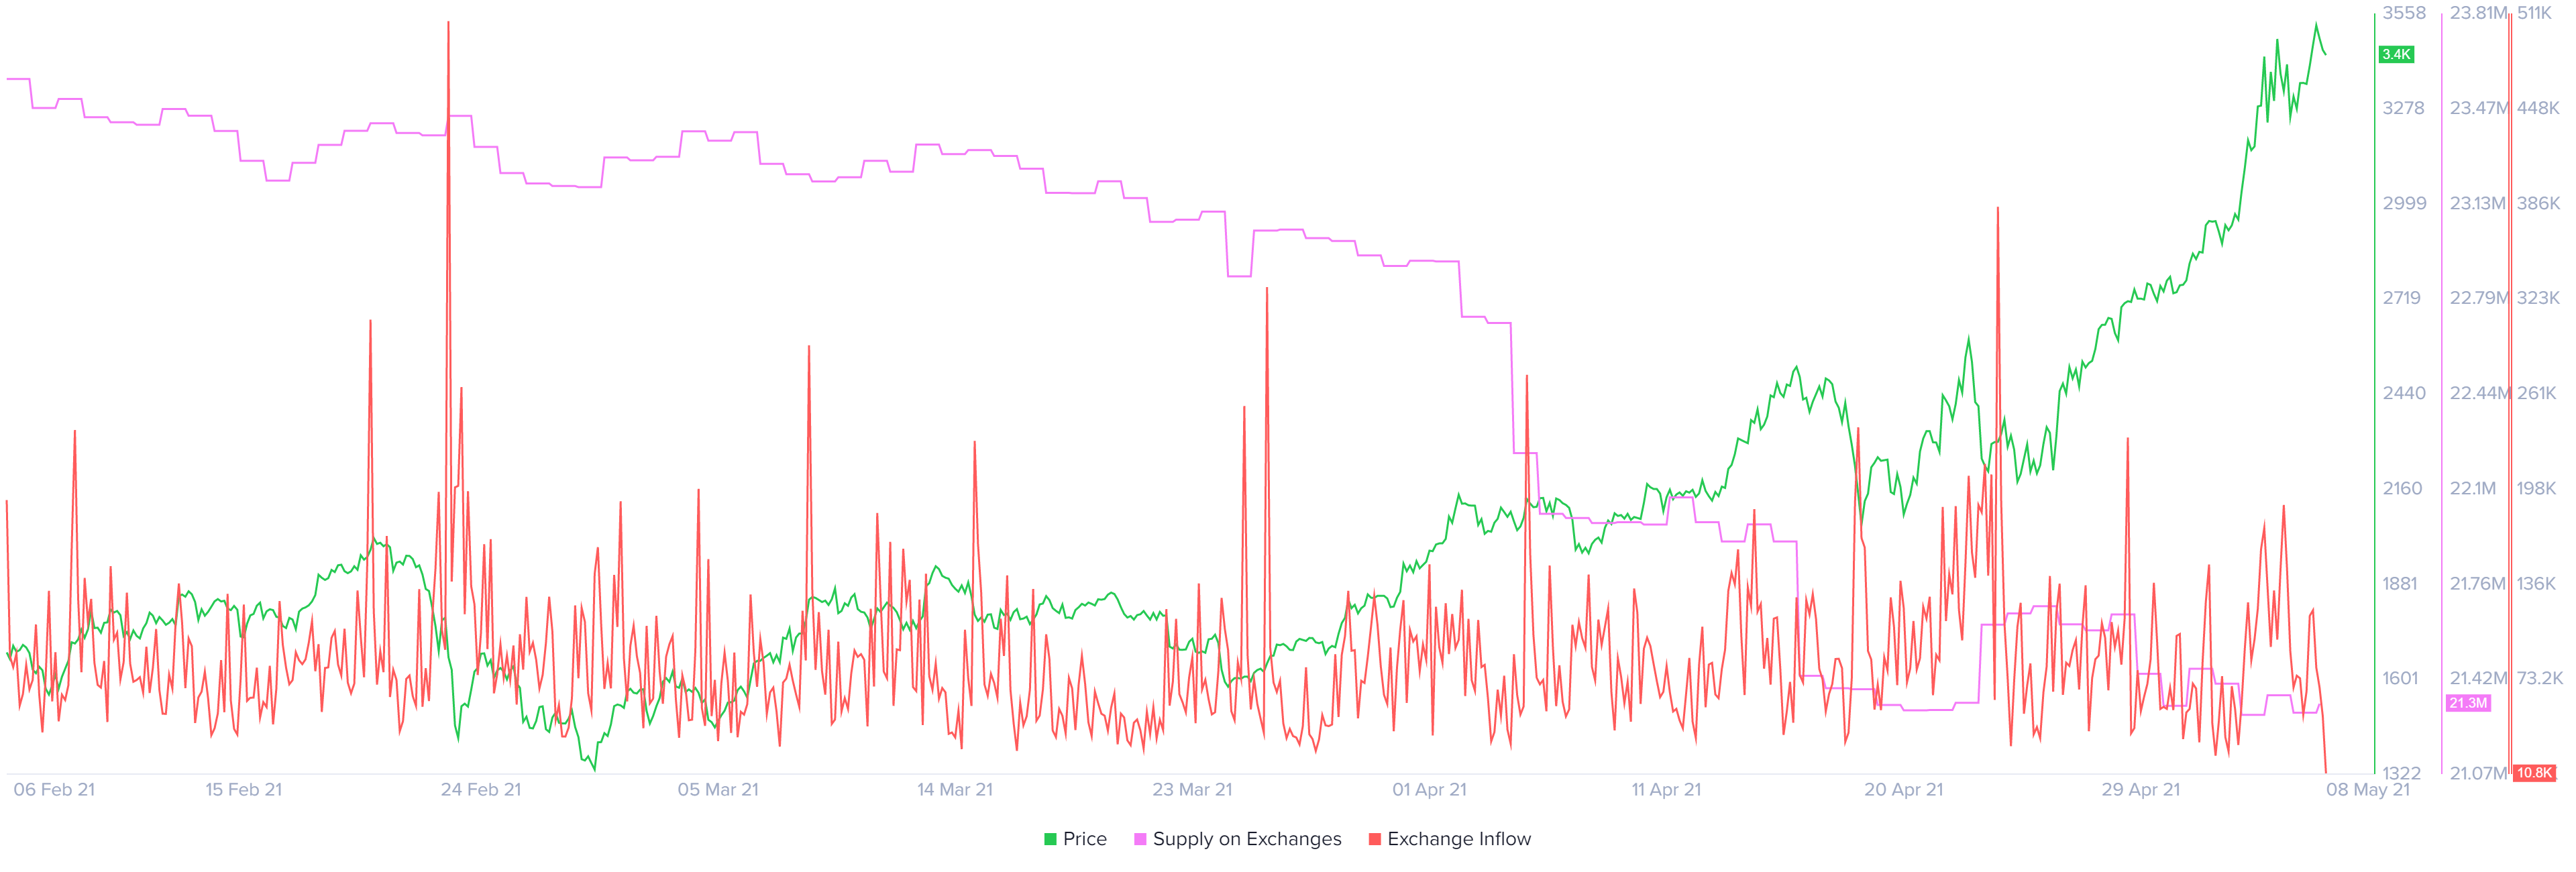
ETH held on exchanges chart
Typically, the number of users holding an asset falls off sharply after hitting a record level, mainly due to investors booking profit. Hence, taking a look at the number of daily active addresses and daily active deposits for ETH allows one to gauge if market participants are looking to sell their holdings.
Despite hitting a new record high, the number of daily active users for the altcoin pioneer has increased by 12% since April 30, suggesting a high network activity. On the other hand, the number of daily active deposits has seen a 7% increase. This minor uptick in daily active addresses, although not bearish, explains the sideways movement.
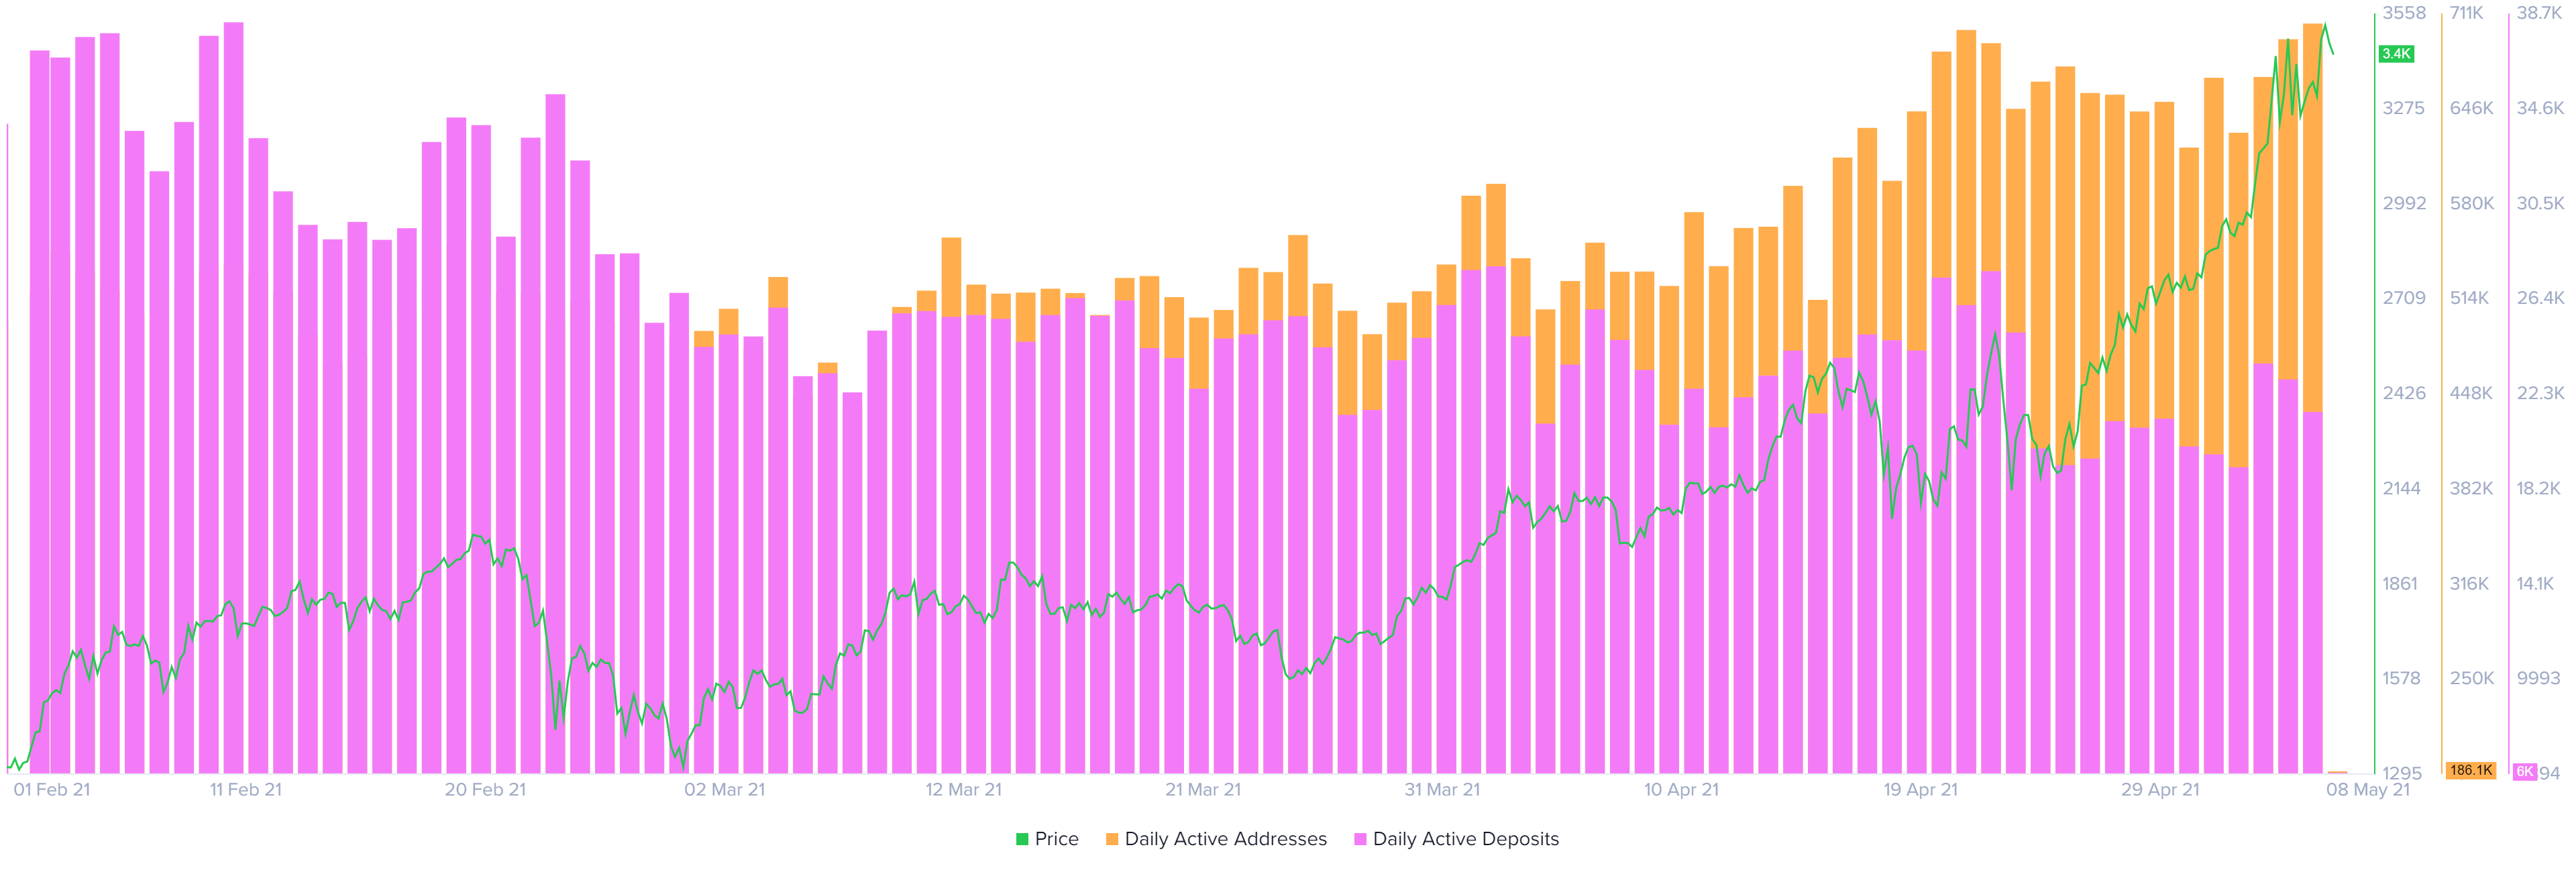
ETH daily active addresses/deposits chart
While most fundamental on-chain indicators suggest a bullish outlook for Ether, the number of transactions worth $100,000 or more has spiked twice today. Often, such upticks in large transfers coincides with local tops. Hence, investors need to be aware of a potential increase in selling pressure.
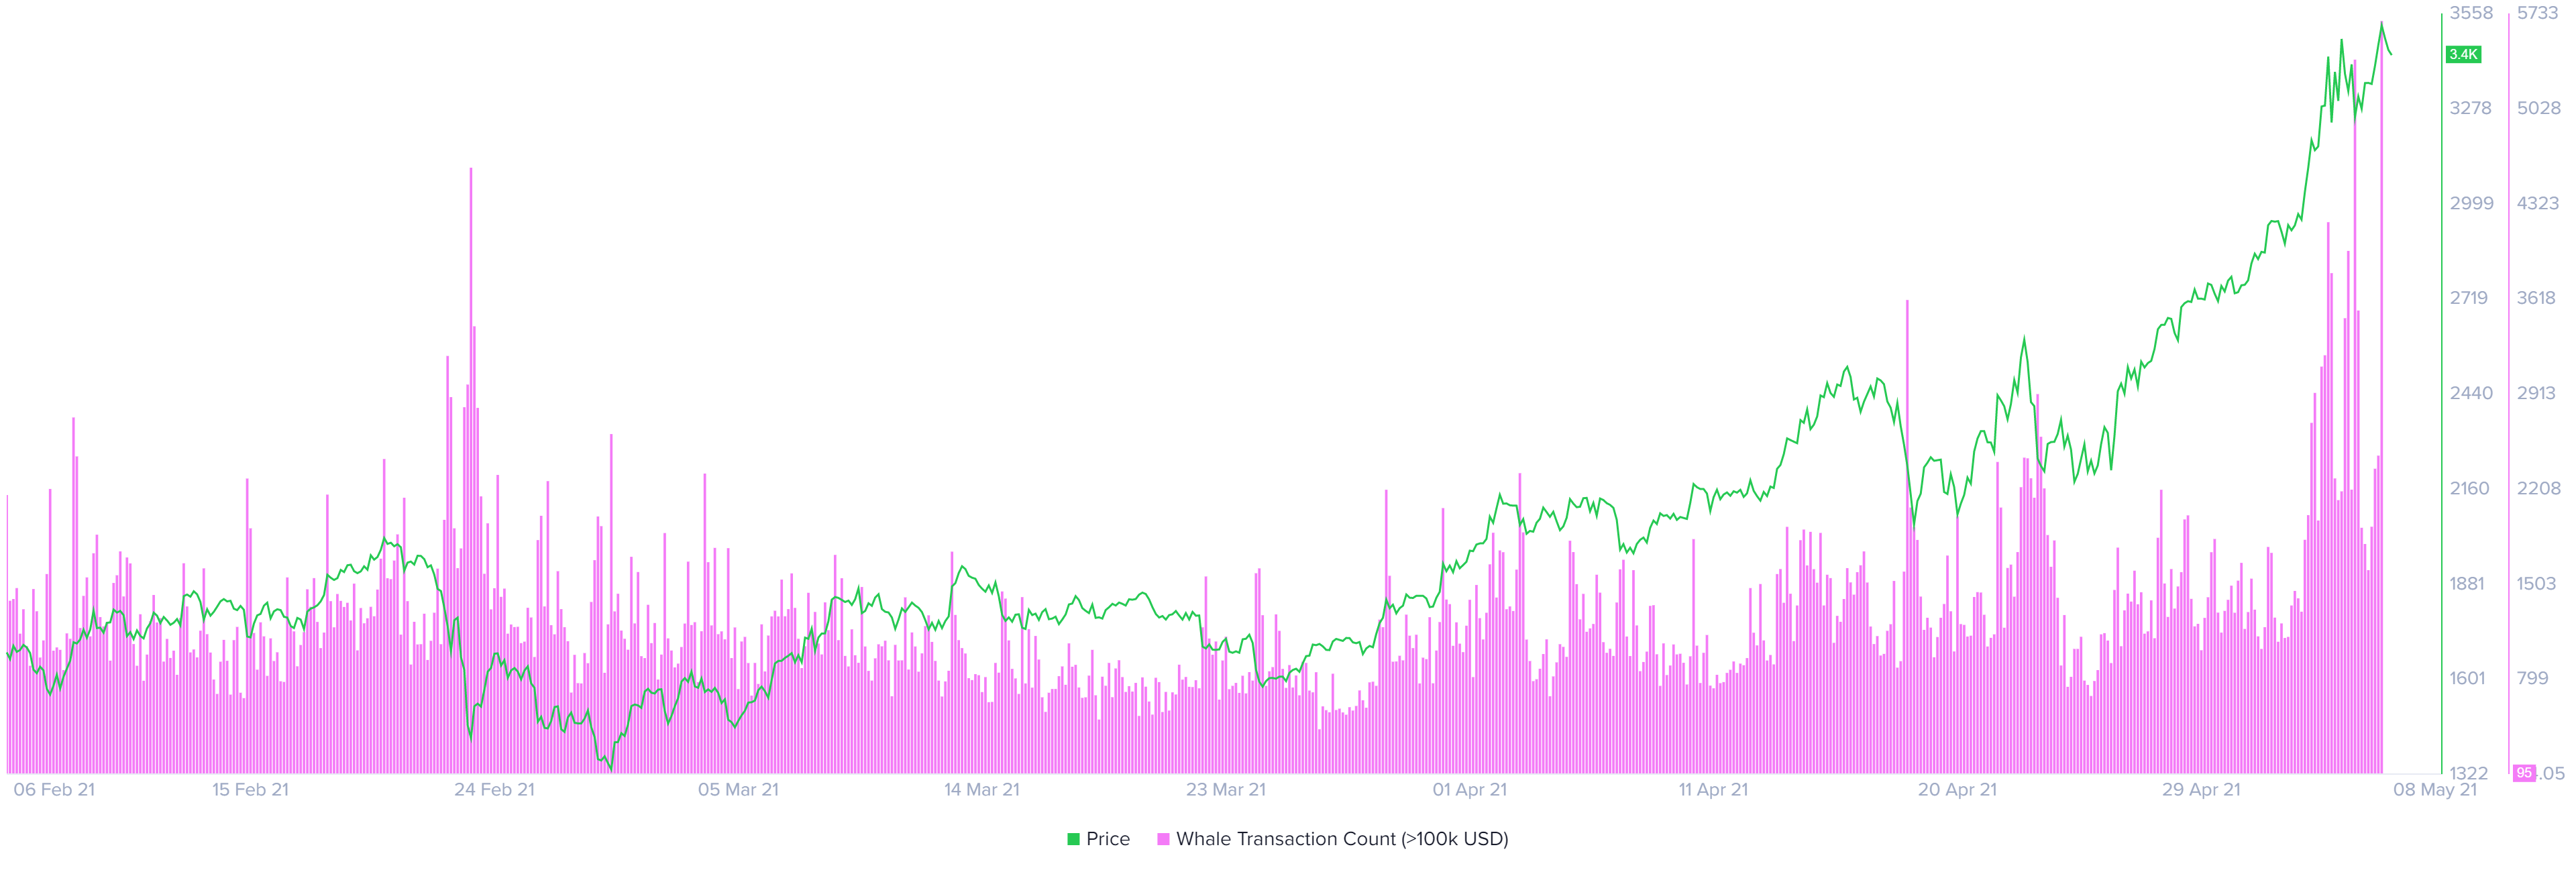
ETH large transaction chart
Adding credence to the bearish outlook is Santiment’s 30-day Market Value to Realized Value (MVRV) model, which indicates that Ethereum price is in the danger zone and could see a potential sell-off shortly.
This fundamental index measures the 30-day profit/loss of users who purchased ETH in the past month. Currently, ETH’s MVRV value is 29%, last seen in May 2019. Therefore, investors need to exercise caution.
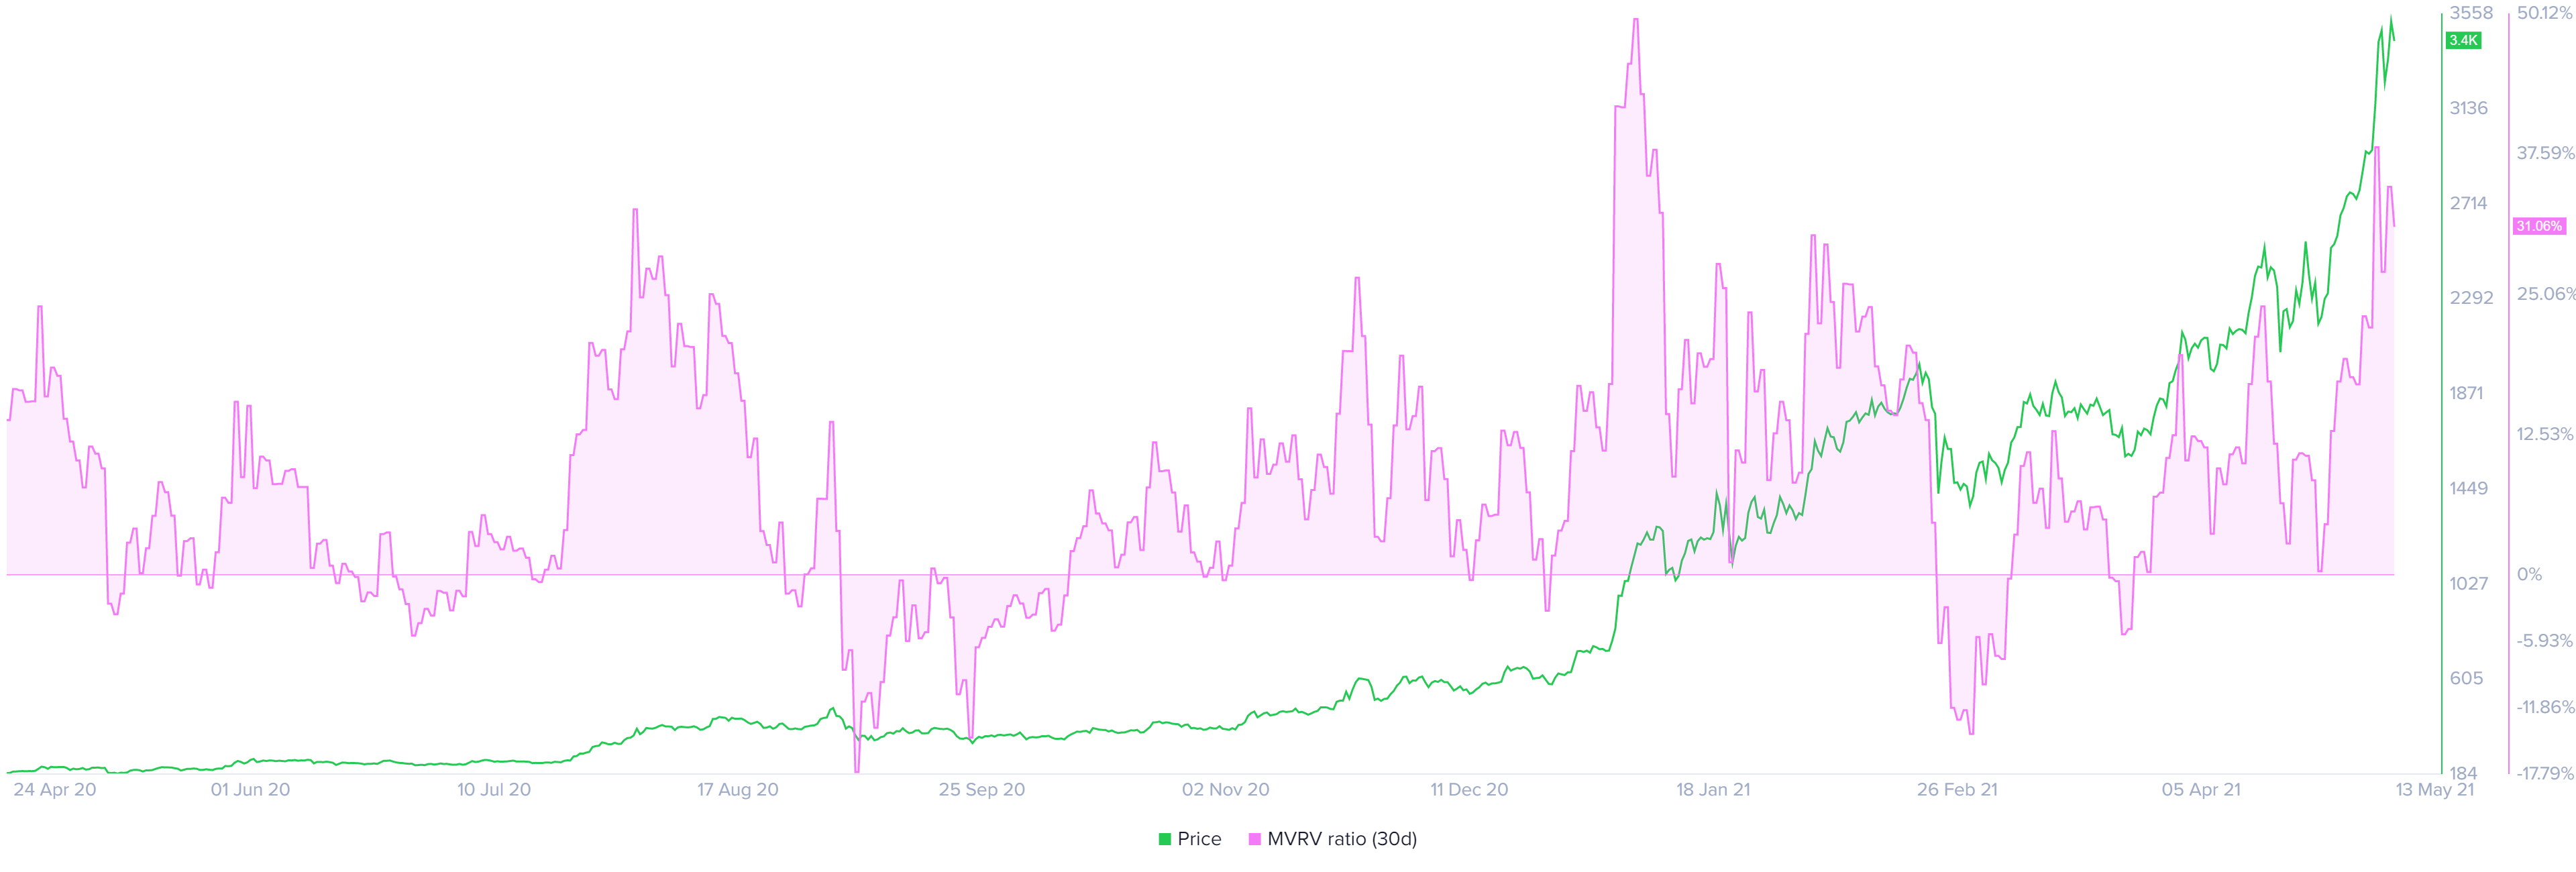
ETH 30-day MVRV chart
Despite the bullish outlook, a breakdown of $3,082 will invalidate the bullish outlook since it would mean a lower low. Such a move could even spark a new downtrend that could push Ethereum price by 5% to the next support barrier at $2,924.


