
July has started with the ongoing bearish impulse on the cryptocurrency market as the majority of the coins are in the red zone.

Top coins by CoinMarketCap
BTC/USD
Yesterday morning, the Bitcoin (BTC) price continued its pullback and returned to the lower border of the sideways range that formed earlier this week.

BTC/USD chart by TradingView
The side corridor is clearly visible on a smaller time frame. Its lower border ($34,000) stopped yesterday's decline and buyers tried to restore the price, but by the end of the day they could not pull the pair out of this sideways range.
In this case, there is a high chance to see the ongoing drop to $32,000.
Bitcoin is trading at $33,300 at press time.
ETH/USD
Yesterday morning, the Ethereum (ETH) price pullback stalled around the $2,100 mark and buyers tried to restore the pair. Only by the end of the day, was the price able to approach the POC indicator line ($2,330), but it could not test it.
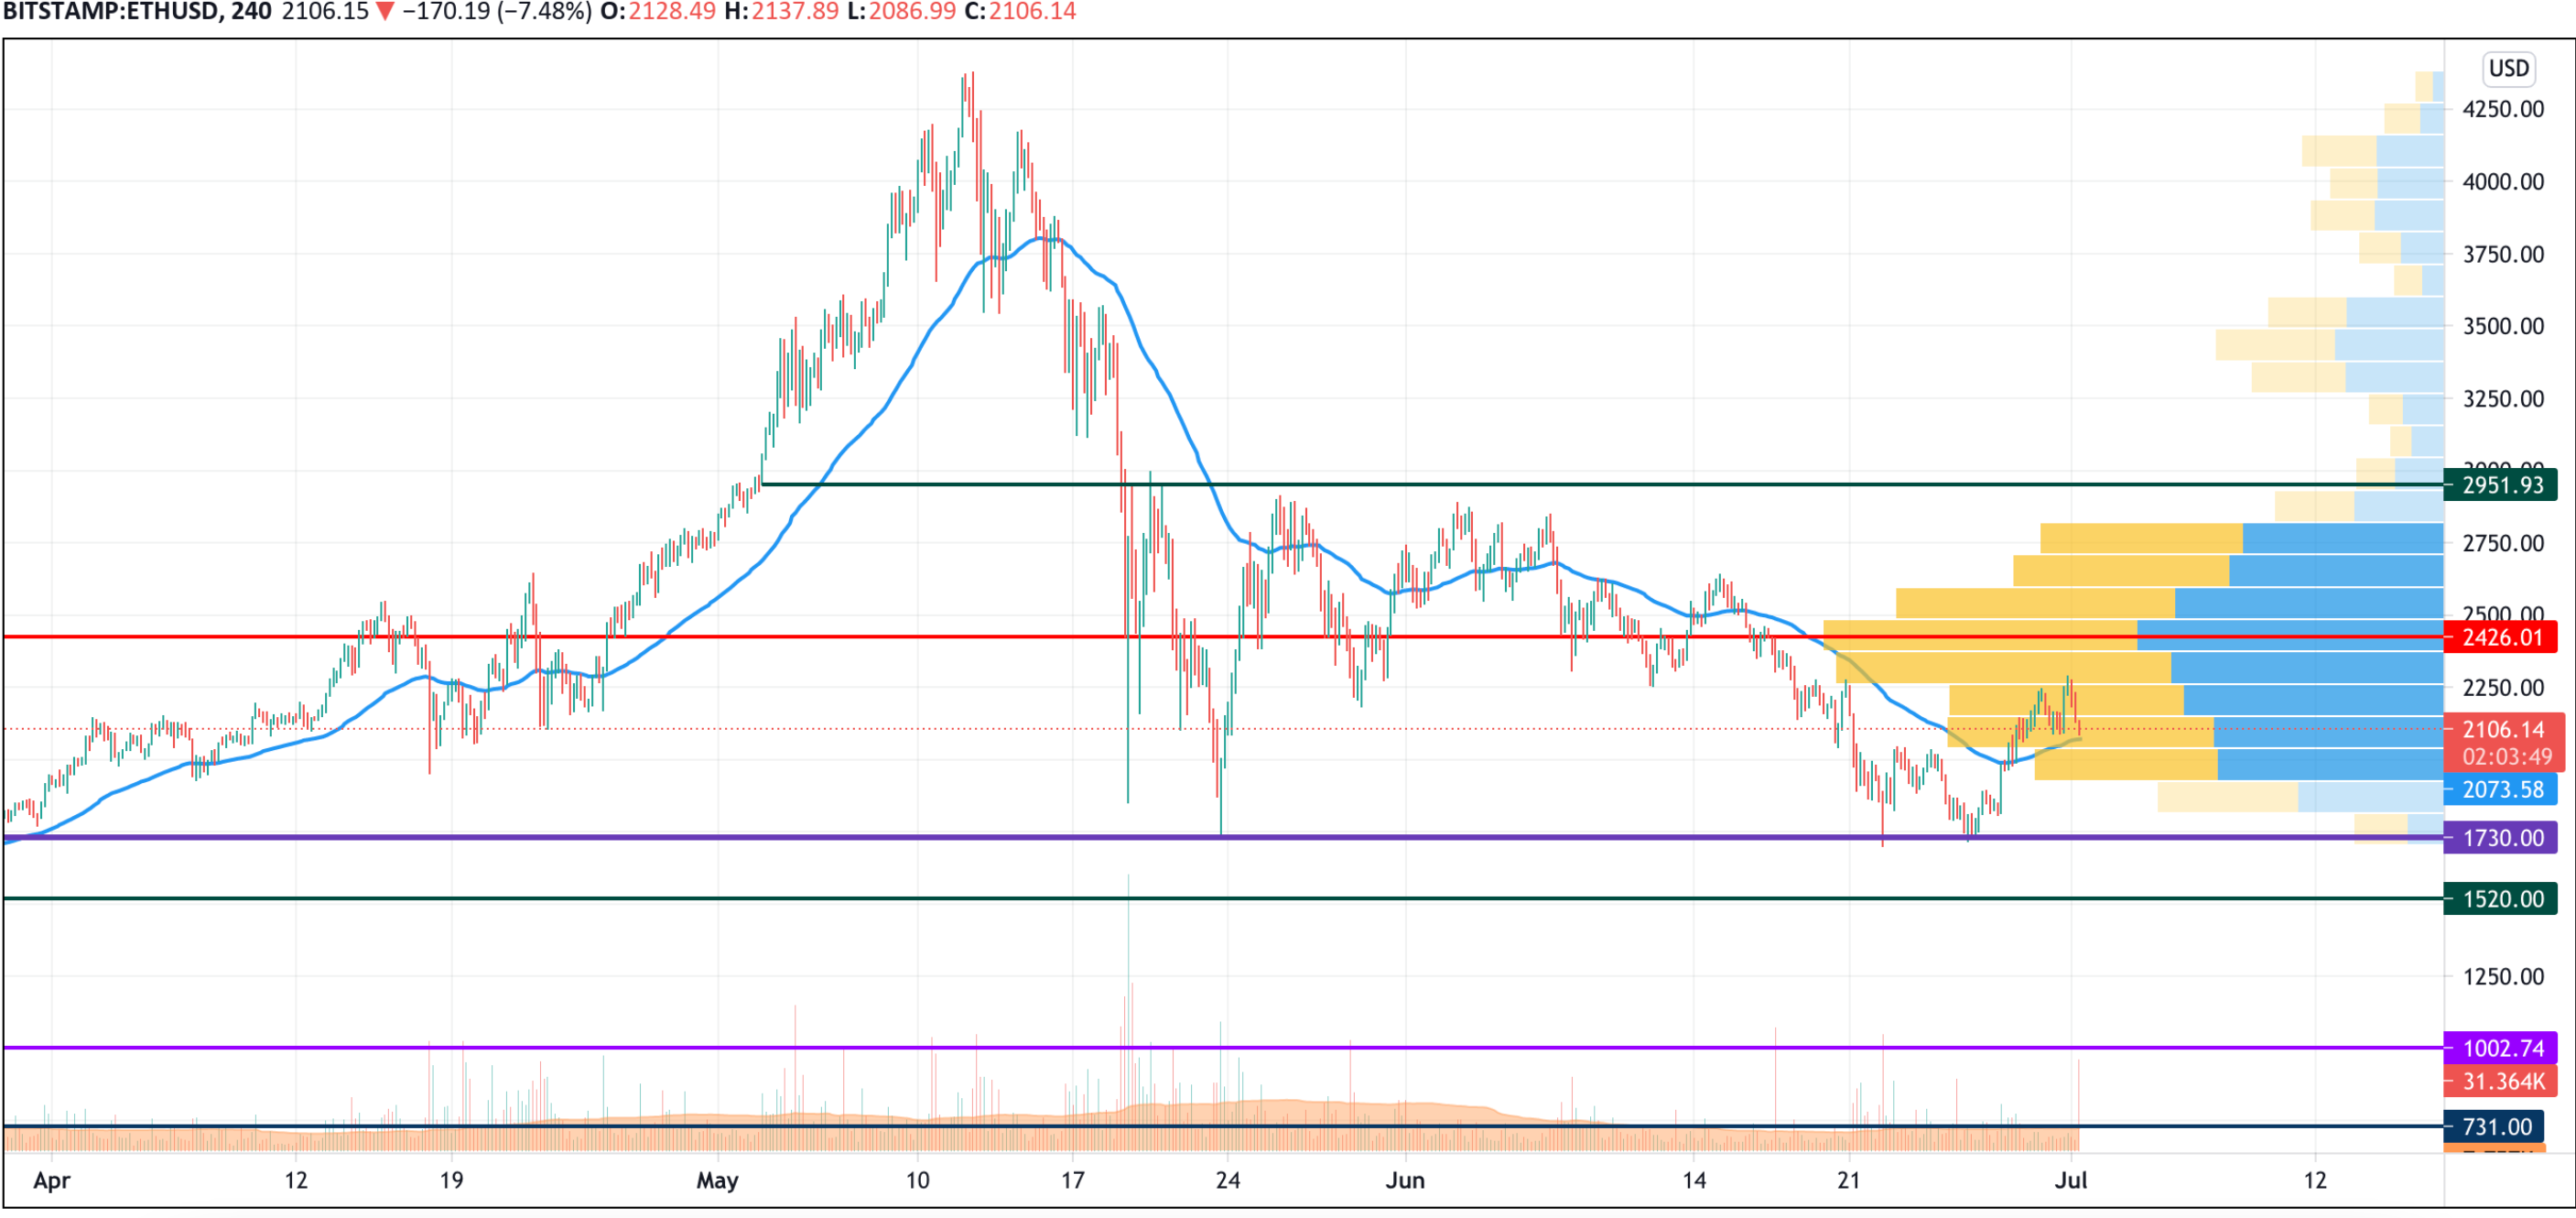
ETH/USD chart by TradingView
As of this morning, the pair rolled back from the local maximum zone and may return to yesterday's support of $2,100 during the day. If buyers are unable to seize the initiative, then the decline may continue below the psychological level of $2,000.
Ethereum is trading at $2,104 at press time.
XRP/USD
Yesterday XRP price set a daily low at $0.648. Buyers tried to seize the initiative and returned the price to the $0.70 mark, but again they failed to gain a foothold above this level.

XRP/USD chart by TradingView
Now one is witnessing a pullback to the area of average prices. If the four-hour EMA55 can withstand the selling pressure, then the price of XRP can be able to bounce above the orange level of $0.70. Otherwise, the pair might return to the upper border of the descending channel.
XRP is trading at $0.6591 at press time.


