
- SafeMoon price is at the precipice of a massive move, which could head either way.
- Concerns of SAFEMOON being a Ponzi scheme pop up due to fee structure.
- A breakdown of the range low at $0.00000260 might trigger a 45% downswing to $0.00000145.
SafeMoon price has been on a slow downtrend as its range tightens, indicating that the volatility has dried up. The price action resembles an awful lot to Bitcoin.
Although an upswing here is unlikely, the downswing will occur if SafeMoon price shatters a vital level. Investors need to be cautious of a sudden spike in bearish momentum as concerns grow over signs of a Ponzi scheme.
Red flags pop up
Meme coins have become a trend, and SafeMoon often gets categorized with others like Dogecoin, Shiba Inu and so on.
While most of these are dog-themed cryptocurrencies, SAFEMOON seems to have attracted negative attention due to its fee structure, which charges 10% to buy and sell the coins. The collected amount is split into halves, with the first half redistributed to existing holders.
The whitepaper details that the second half is once again divided into two halves, half of which,
is sold by the contract into BNB, while the other half of the SAFEMOON tokens are paired automatically with the previously mentioned BNB and added as a liquidity pair on Pancake Swap.
Dave Portnoy, the founder of Barstool Sports, was one of the first people to point out how it could be a “Ponzi scheme.” SafeMoon has received criticism from many for this structure and how it could create opportunities for a massive “pump and dump” scheme.
Portnoy, who pledged allegiance to SAFEMOON by buying $40,000 worth of it, said,
It could be a Ponzi Scheme… If it is a Ponzi scheme, get in on the ground floor.
Another point of contention among critics is the manual burning mechanism that this cryptocurrency has. So far, 223 trillion developer-allocated tokens have been burned, reducing the supply of SafeMoon from 1 quadrillion to 777 trillion.
As per the SafeMoon website, the current circulating supply stands around 580 trillion, with its market capitalization hovering at approximately $1.59 billion. This metric has dropped roughly 73.5% from its all-time high of nearly $6 billion.
While these concerns have plagued the cryptocurrency and its investors, the technicals also show that the bearish pressure could prevail.
SafeMoon price lacks momentum
SafeMoon price has seen a considerable slowdown in its descent as it trades above the range low at $0.00000260. Since its all-time high on May 11, SAFEMOON has crashed 71% to where it currently trades – $0.00000275.
Since its retest of the $0.00000338 resistance level, the downtrend has shed its volatility to a point where each daily candlestick has less than 5% change. This trend has been ongoing over the past ten days as it slowly makes its way to retest the range low at $0.00000260.
This development brings SAFEMOON to an inflection point where a breakdown of the said level could lead to a 25% sell-off to $0.00000198. If the selling pressure persists, the crash could extend another 26% to tag the immediate support barrier at $0.00000145.
Perhaps, the primary reason for this bearishness is SAFEMOON’s correlation with Bitcoin and the pessimistic outlook displayed by the latter. Other concerns include the death cross between the 50-day and 100-day Simple Moving Average (SMA) seen on July 5, which, interestingly, coincides with the starting point of diminishing volatility.
Therefore, going forward, investors can expect a bearish descent to follow a breakdown of the range low at $0.00000260.
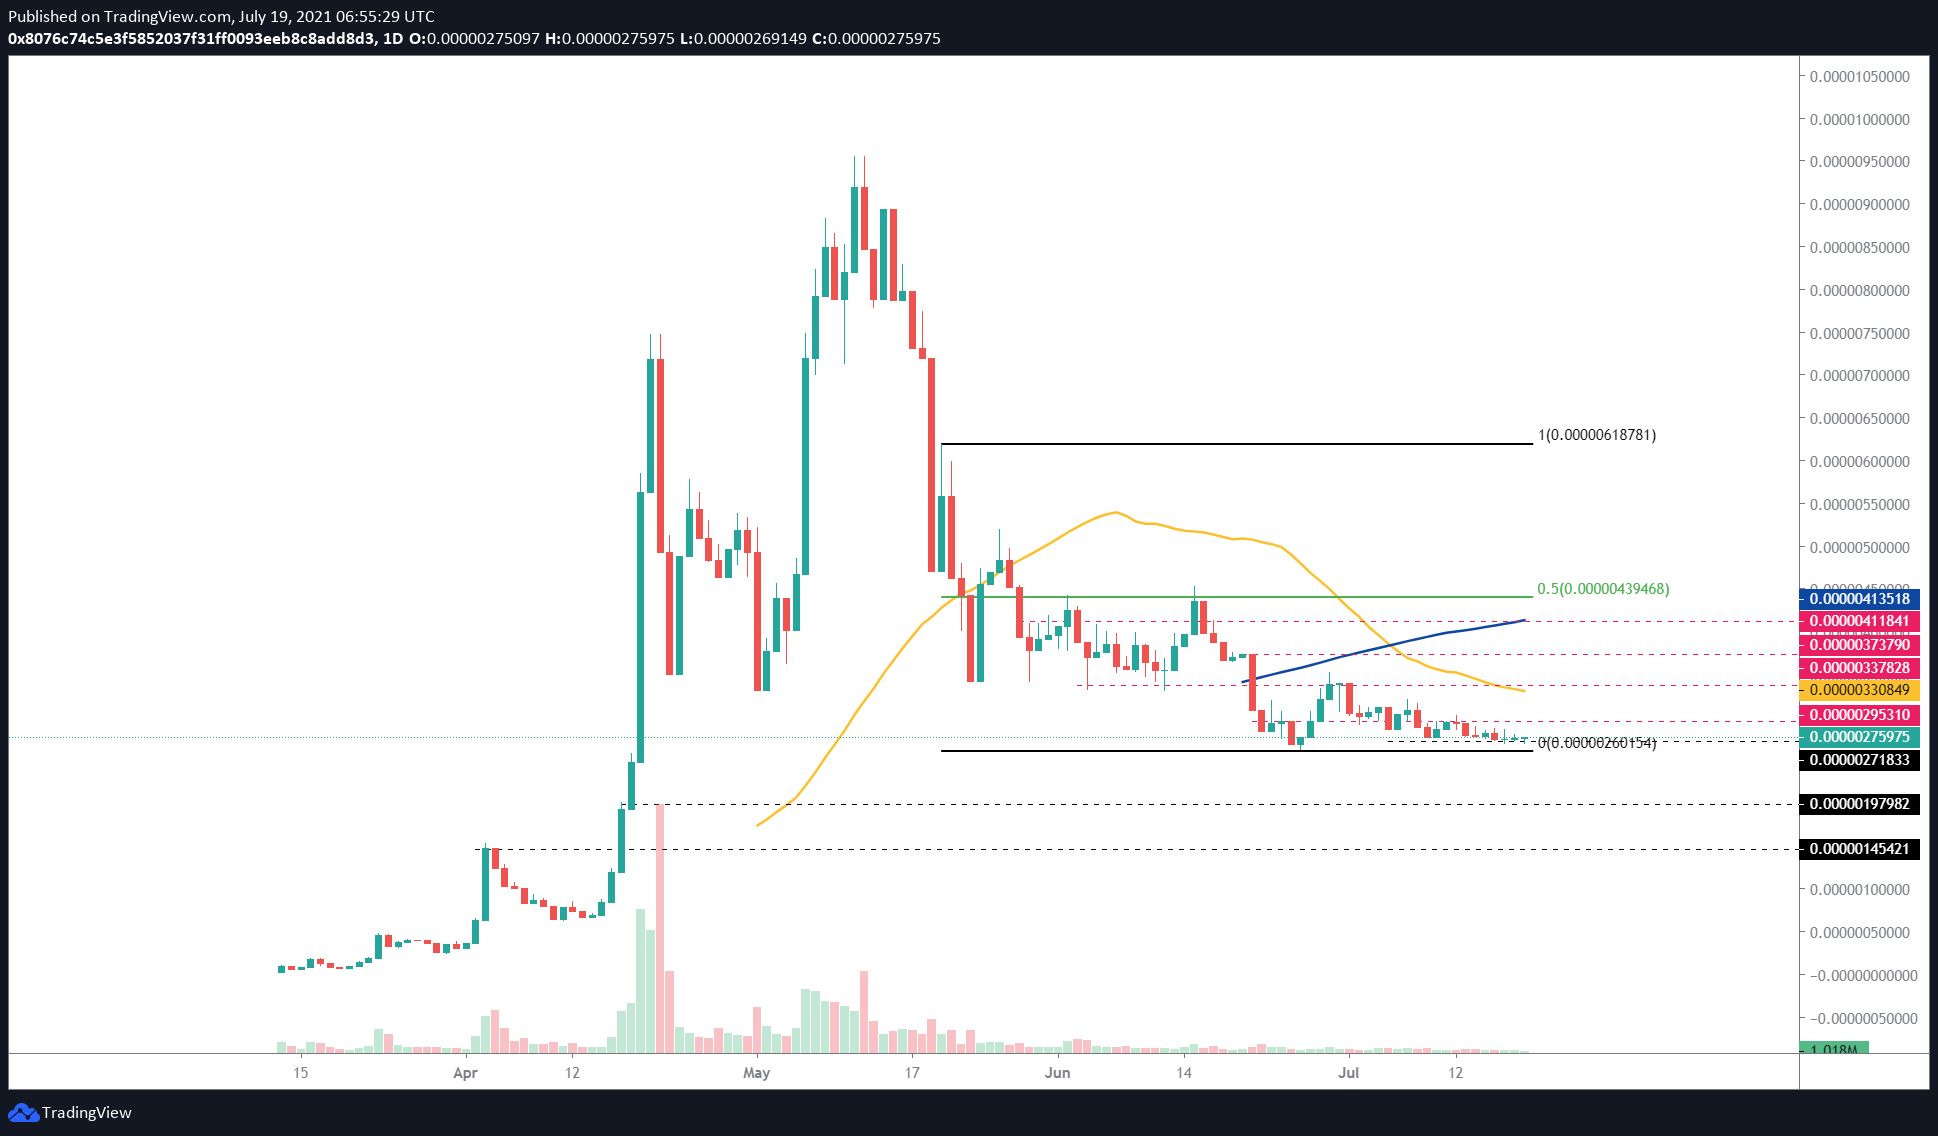
SAFEMOON/USDT 1-day chart
While everything seems to be going against SafeMoon price, there are some things to be hopeful about. The founders of SAFEMOON are not anonymous, which might bring a sigh of relief for the investors.
As for the “Ponzi Scheme” title, the CEO, John Karony, denied it, stating that he had put his “credibility and identity on the line” for SafeMoon. He also revealed that the cryptocurrency in question and its fee structure resemble big tech companies like Amazon, where earlier investors will receive higher returns.
Instead of a breakdown of the range low at $0.00000260, if the buying pressure spikes, leading to a decisive daily candlestick close above the 50-day SMA at $0.00000331, it will invalidate the bearish thesis and further strengthen the upswing narrative.
If the bid orders continue to flow, this climb could extend another 25% to tag the 100-day SMA at $0.00000414. In some cases, the bulls could tag the trading range’s midpoint at $0.00000439.


