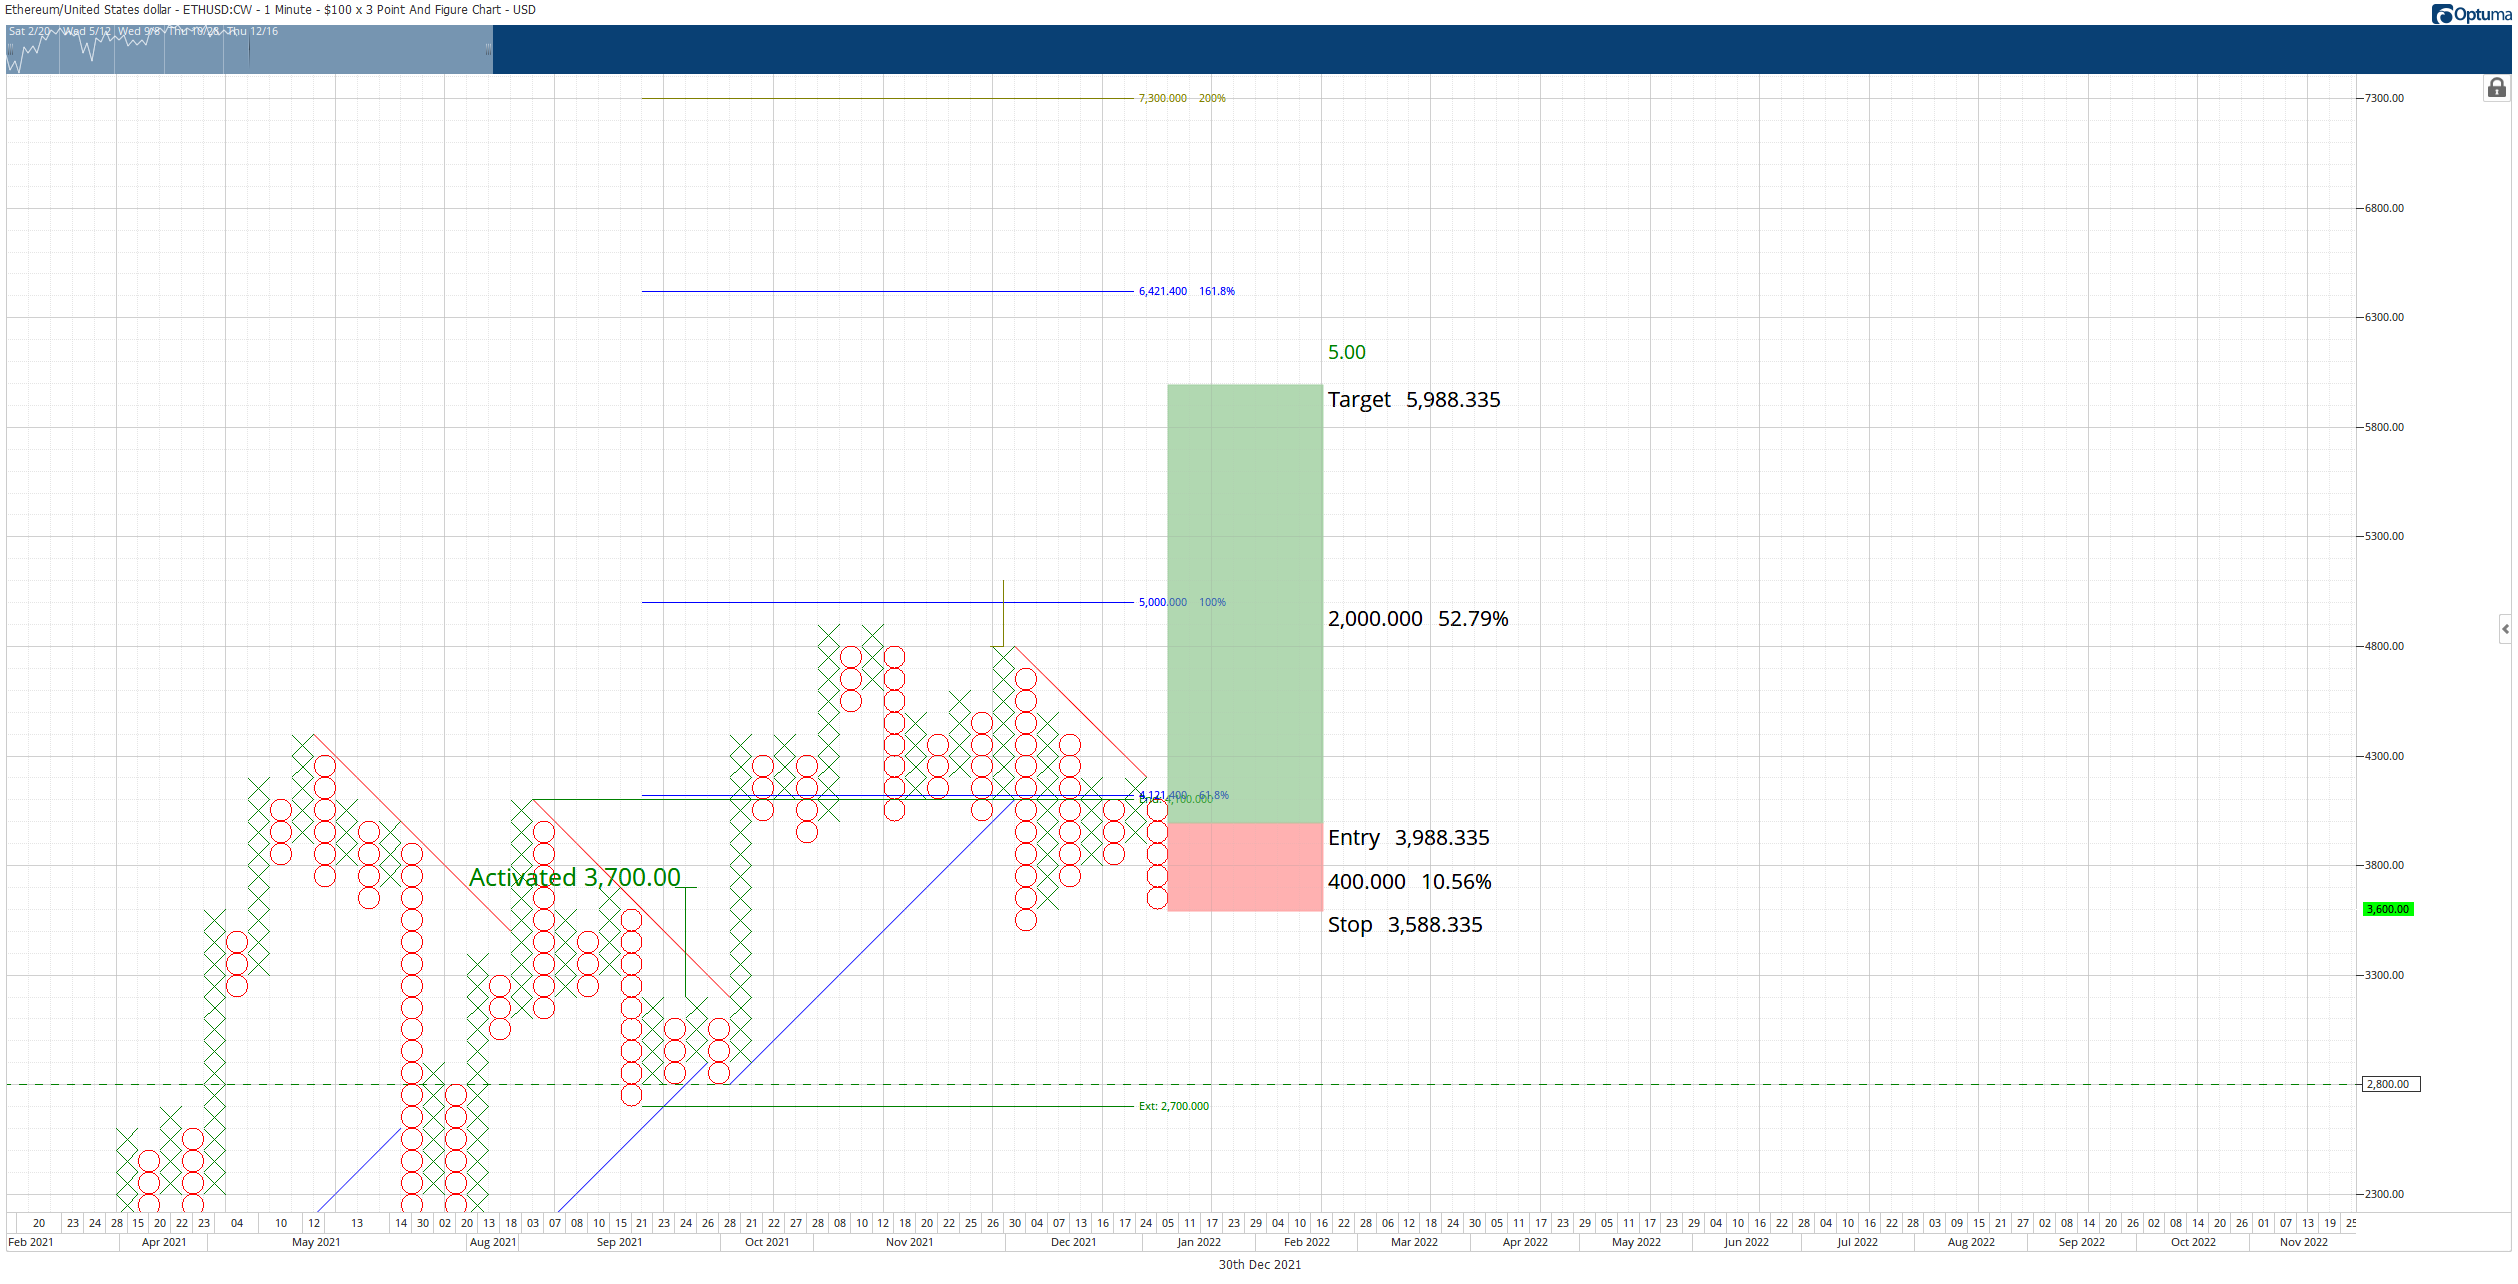
- Ethereum price develops a potent bullish reversal signal on its Point and Figure chart.
- A massive short squeeze is incoming.
- Downside risks exist but are very limited in scope and range.
Ethereum price has just created sufficient conditions for one of the most potent bullish reversal signals in Point and Figure analysis. The potential trade could trigger a $2,000 rise from the entry with a more than 50% gain.
Ethereum price prepared to explode higher; $6,000 value area is in sight
Ethereum price has one of the best bullish reversal setups it has seen in a while on the $100/3-box reversal Point and Figure Chart. The pattern is known as a Bullish Shakeout. The pattern requires a multiple bottom followed by at least two but no more than three Os below that multiple bottom. Additionally, the trend must already be bullish.
What makes this setup so explosive for Ethereum price is likely to occur immediately after the entry. As a result, two events would likely happen simultaneously—first, a breakout above a triple top. Second, a breakout above the current bear market trendline (red diagonal line) that would then convert Ethereum into a bull market.
The hypothetical long entry for Ethereum price is a buy stop order at $4,000, a stop loss at $3,500, and a profit target at $6,000. This trade represents a 5:1 risk for the reward and 52% implied gain from the entry. A trailing stop of two to three boxes would help protect any potential profit after the entry is triggered.

ETH/USD $100/3-box Reversal Point and Figure Chart
This trade setup is invalidated if Ethereum price moves to $3,300. In that scenario, Ethereum would like see a bearish setup to target the $2,800 value area.


