
- Shiba Inu price could be headed for a 35% nosedive if the token breaks below $0.00002817.
- SHIB could fall further to discover reliable support before tagging the lower boundary of the governing technical pattern.
- Shiba Inu must slice above $0.00003549 to reverse the period of underperformance.
Shiba Inu price is on the verge of a significant decline if the bulls fail to claim $0.000002817 as support. Sliding below the aforementioned foothold could put a 35% descent on the radar.
Shiba Inu bears eye $0.00001935 next
Shiba Inu price has formed a descending parallel channel on the 12-hour chart, as SHIB continued to record lower highs and lower lows.
Shiba Inu price attempted to slice above the upper boundary of the prevailing chart pattern on December 28 to reverse the period of sluggish performance. However, selling pressure increased and SHIB slid lower, falling back into the consolidation pattern.
The first line of defense for Shiba Inu price is at the December 4 low at $0.00002952. SHIB price may discover another foothold at the December 21 low at $0.00002817. If the token falls below this level of support, the canine-themed cryptocurrency could be at risk of a 35% slide toward $0.00001935.
The middle boundary of the governing technical pattern at $0.00002659 would act as the intermediate line of defense for Shiba Inu price before the bears prepare for the massive decline toward the lower boundary of the parallel channel at $0.00001935.
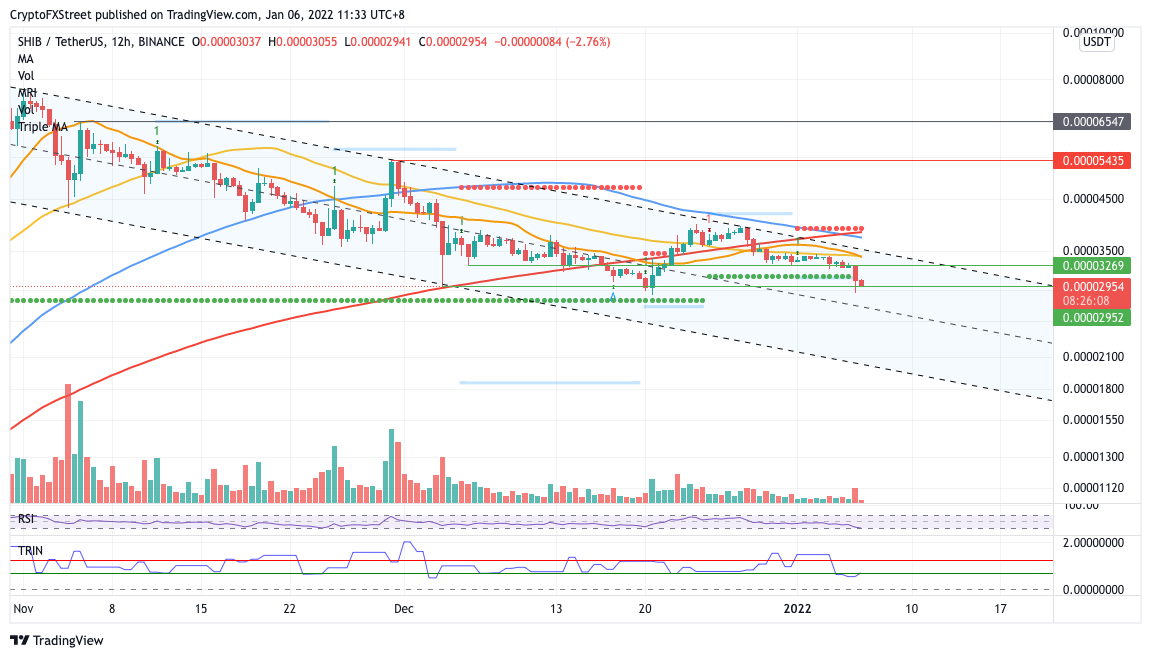
SHIB/USDT 12-hour chart
However, if buying pressure increases for Shiba Inu price, the first level of resistance is at the December 6 low at $0.00003269. Additional obstacles will emerge at $0.00003415, where the 50 twelve-hour Simple Moving Average (SMA) and the 21 twelve-hour SMA intersect, then at the upper boundary of the prevailing chart pattern at $0.00003549.
If the bulls manage to slice above the aforementioned line of resistance, Shiba Inu price may finally be able to witness a recovery, to reverse the period of underperformance.
However, an additional headwind will emerge at $0.00003815, where the 100 twelve-hour SMA, 200 twelve-hour SMA and resistance line given by the Momentum Reversal Indicator (MRI) coincide.


