- Test of a broadening triangle has bolstered the odds of a downside move ahead.
- The asset has surrendered the cushion of 20-EMA at 0.6635.
- A drop in the bearish range by the RSI (14) will trigger a downside momentum.
The AUD/USD pair is dropping sharply after facing barricades around 0.6670 in the Asian session. The asset is expected to re-test a two-year low, recorded on Thursday at 0.6574. The major has refreshed its intraday low at 0.6616 and is looking to display more weakness.
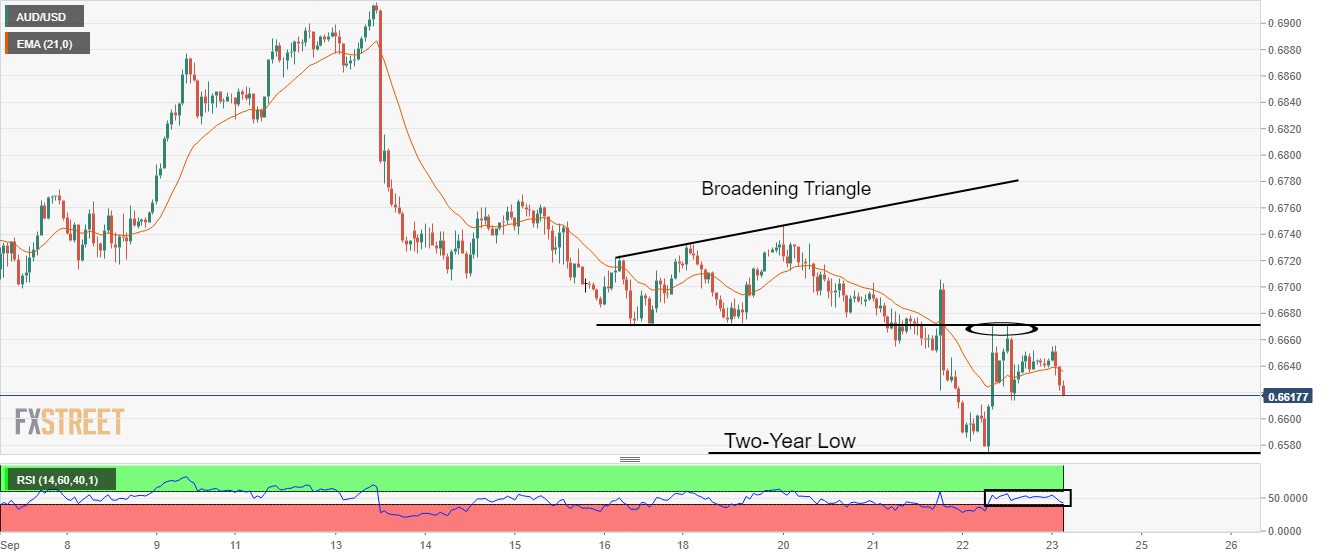
On an hourly scale, the aussie bulls have witnessed a steep fall after displaying a textbook kind of test and drop of a broadening triangle chart pattern. The upward sloping trendline of the broadening triangle is plotted from September 16 high at 0.6724 while the horizontal support turned resistance now is placed from September 16 low at 0.6670.
The asset has dropped below the 20-period Exponential Moving Average (EMA) at 0.6635, which has weakened the aussie bulls further.
Also, the Relative Strength Index (RSI) (14) is on the verge of dropping into the bearish range of 20.00-40.00, which will trigger the downside momentum.
A drop below the two-year low at 0.6580 will drag the asset towards 26 May 2020 low at 0.6538, followed by the psychological support at 0.6500.
On the flip side, a break above Thursday’s high at 0.6670 will drive the asset towards September 18 high at 0.6734 and September 15 high at 0.6770.
AUD/USD hourly chart