
- AUD/USD regains upside momentum following its bounce off 200-HMA.
- Bullish chart pattern, MACD conditions also tease buyers.
- Bears seek 0.7200 breakdown to revisit the bumpy road to yearly low.
AUD/USD teases confirmation of a bullish chart pattern around 0.7240, up 0.08% intraday heading into Friday’s European session.
In doing so, the Aussie pair justifies its bounce off 200-HMA as the MACD signal line teases bulls.
However, a clear upside break of 0.7250 becomes necessary to confirm the bullish flag chart formation.
Following that, the theoretical target directs AUD/USD buyers toward the monthly high near 0.7425. During the rise, July’s low near 0.7290 and August 11 peak surrounding 0.7390 can challenge the upside moves.
Alternatively, 200-HMA restricts pullback moves near 0.7220 before the support line of the stated flag, around 0.7215.
Though, the August 24 swing low near the 0.7200 round figure holds the gate for the AUD/USD pair’s further downside targeting the yearly bottom surrounding 0.7100.
The 50% and 61.8% Fibonacci retracement of August 20–25 upside, respectively near 0.7190 and 0.7170, adds to the downside filters.
AUD/USD: Hourly chart
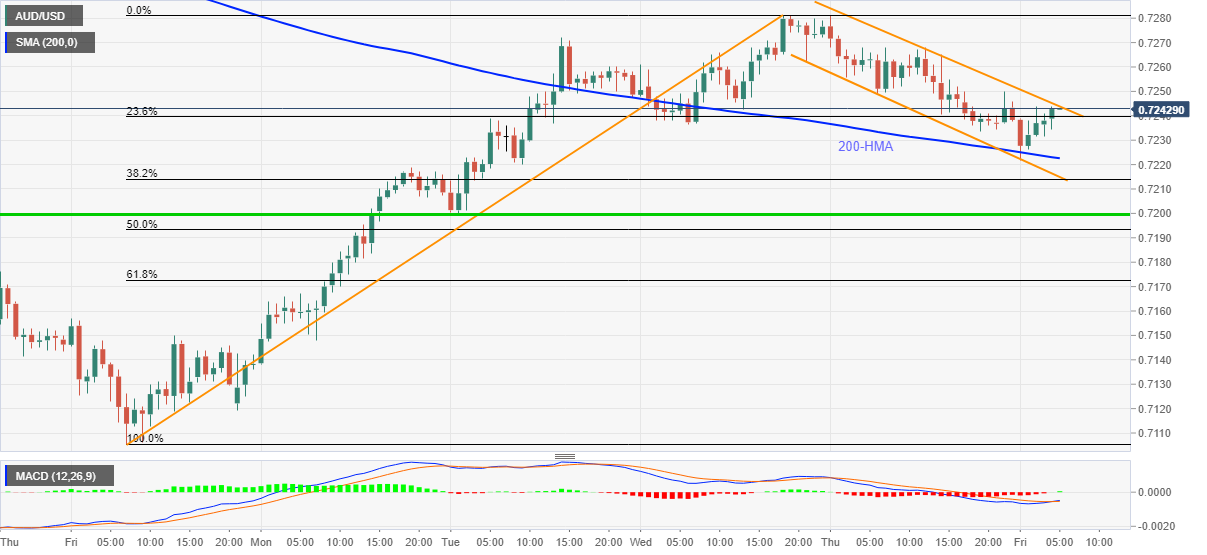
Trend: Further upside expected


