
- AUD/USD remains firmer around one-week high during three-day uptrend.
- Firmer RSI, sustained trading beyond 200-SMA keeps buyers hopeful.
- Confirmation of bullish chart pattern becomes necessary for further upside.
- The monthly support line adds to the downside filters.
AUD/USD picks up bids to refresh one-week high around 0.7215, up 0.16% intraday during Thursday’s Asian session. In doing so, the Aussie pair rises for the third consecutive day while also bracing for a third consecutive weekly gain.
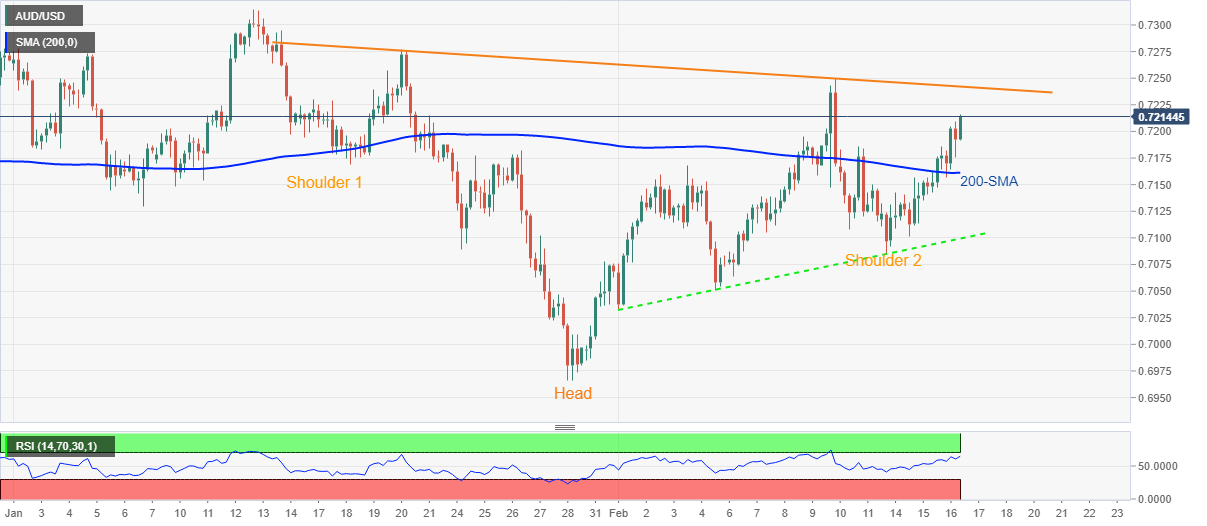
It’s worth noting that the risk barometer pair’s performance during the last one-month teases an inverse Head-and-Shoulders (H&S) bullish chart pattern.
Given the quote’s successful break of the 200-SMA, coupled with the upbeat RSI, the AUD/USD prices are well-directed to the stated formation’s neckline, around 0.7245.
However, a clear upside break of the 0.7245 will boost buyer’s morale with a 300-pip theoretical target based on the H&S pattern.
For the short-term, the monthly peak of 0.7250 and January’s high near 0.7315 could lure the pair buyers.
Alternatively, pullback moves remain elusive beyond the 200-SMA level of 0.7161, a break of which will direct AUD/USD sellers towards an upward sloping trend line from February 01, close to 0.7100 by the press time.
In a case where the quote drops below 0.7100, the odds of its southward trajectory targeting the sub-0.7000 area can’t be ruled out.
AUD/USD: Four-hour chart
Trend: Further upside expected


