
- AUD/USD picks up bids inside a bearish chart pattern heading into RBA.
- Sluggish RSI, MACD and the wedge’s position around multi-day peak keep sellers hopeful.
- 100-SMA adds to the downside filters ahead of the theoretical target.
- RBA is expected to keep monetary policy rates unchanged, forward guidance eyed.
AUD/USD recovers early Asian losses around 0.7525 ahead of the Reserve Bank of Australia (RBA) monetary policy decision on early Tuesday.
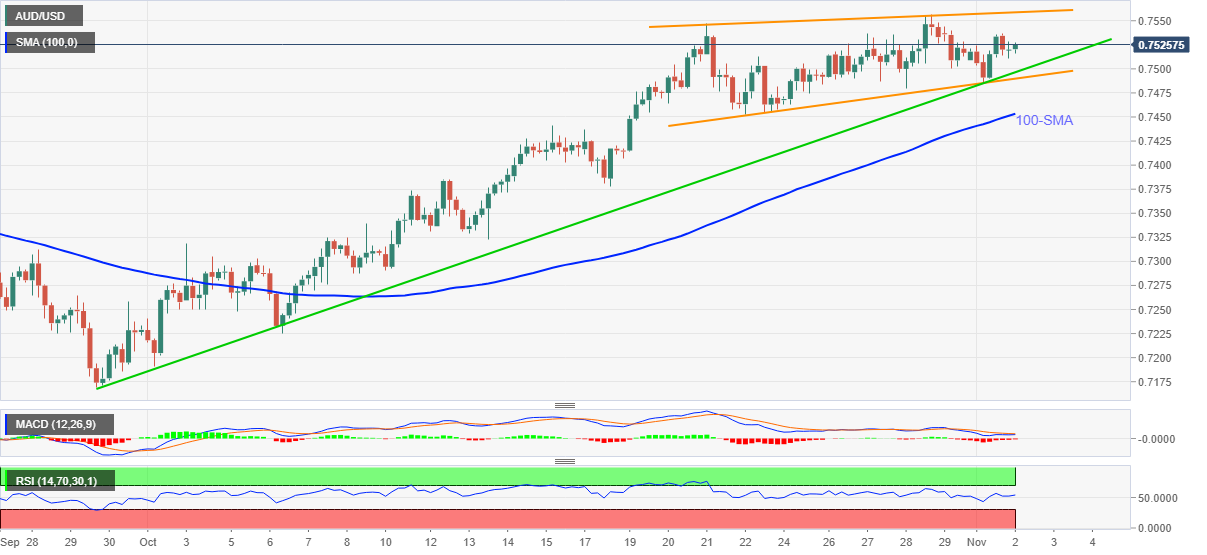
The Aussie pair’s rebound from a one-month-old support line the previous day portrayed a short-term rising wedge bearish chart pattern on the four-hour play. Also keeping the pair sellers hopeful is the stated formation’s place near the highest levels since July, as well as sluggish moves of the MACD and RSI lines.
However, the quote needs validation from the 100-SMA level of 0.7455, following a downside break of the wedge’s support near 0.7490, to confirm the bearish trajectory towards the theoretical target near 0.7390-80.
In a case where AUD/USD prices remain weak past 0.7380, the early October peaks near 0.7330 will be the key to watch.
Alternatively, further recoveries may aim for the 0.7550 level before hitting the resistance line of the bearish chart pattern around 0.7560.
If at all the AUD/USD bulls keep reins past 0.7560, the late June’s high near 0.7620 should return to the chart.
AUD/USD: Four-hour chart
Trend: Pullback expected


