
- Axie Infinity price shows hints of some attempts at a bullish breakout, possibly countering the broader cryptocurrency market.
- Downside risks remain, but few altcoins have a chart setup that would support a bullish move.
- A powerful Point and Figure chart pattern could trigger an explosive move higher.
Axie Infinity price can rally for a 20% gain if a split-triple top pattern in Point and Figure analysis is broken. However, danger caution should remain if the broader cryptocurrency market continues to weaken and becomes exceedingly bearish.
Axie Infinity price could spike to $82 could see outperformance of Bitcoin and Ethereum
Axie Infinity price has a rare Point and Figure chart pattern developing known as a Split Triple-Top. The triple-top will develop if buyers push Axie Infinity to $70. Thus, the hypothetical entry would be $71 with the risk limited to $68 and the hypothetical profit potential at $82.
Again, Axie Infinity is one of the rare altcoins that has the potential to achieve a bullish breakout amidst any broader bearish sentiment. However, there is a bearish scenario for Axie Infinity price that would terminate any near-term bullish sentiment – and the move on the short side is considerably larger than any upside potential.
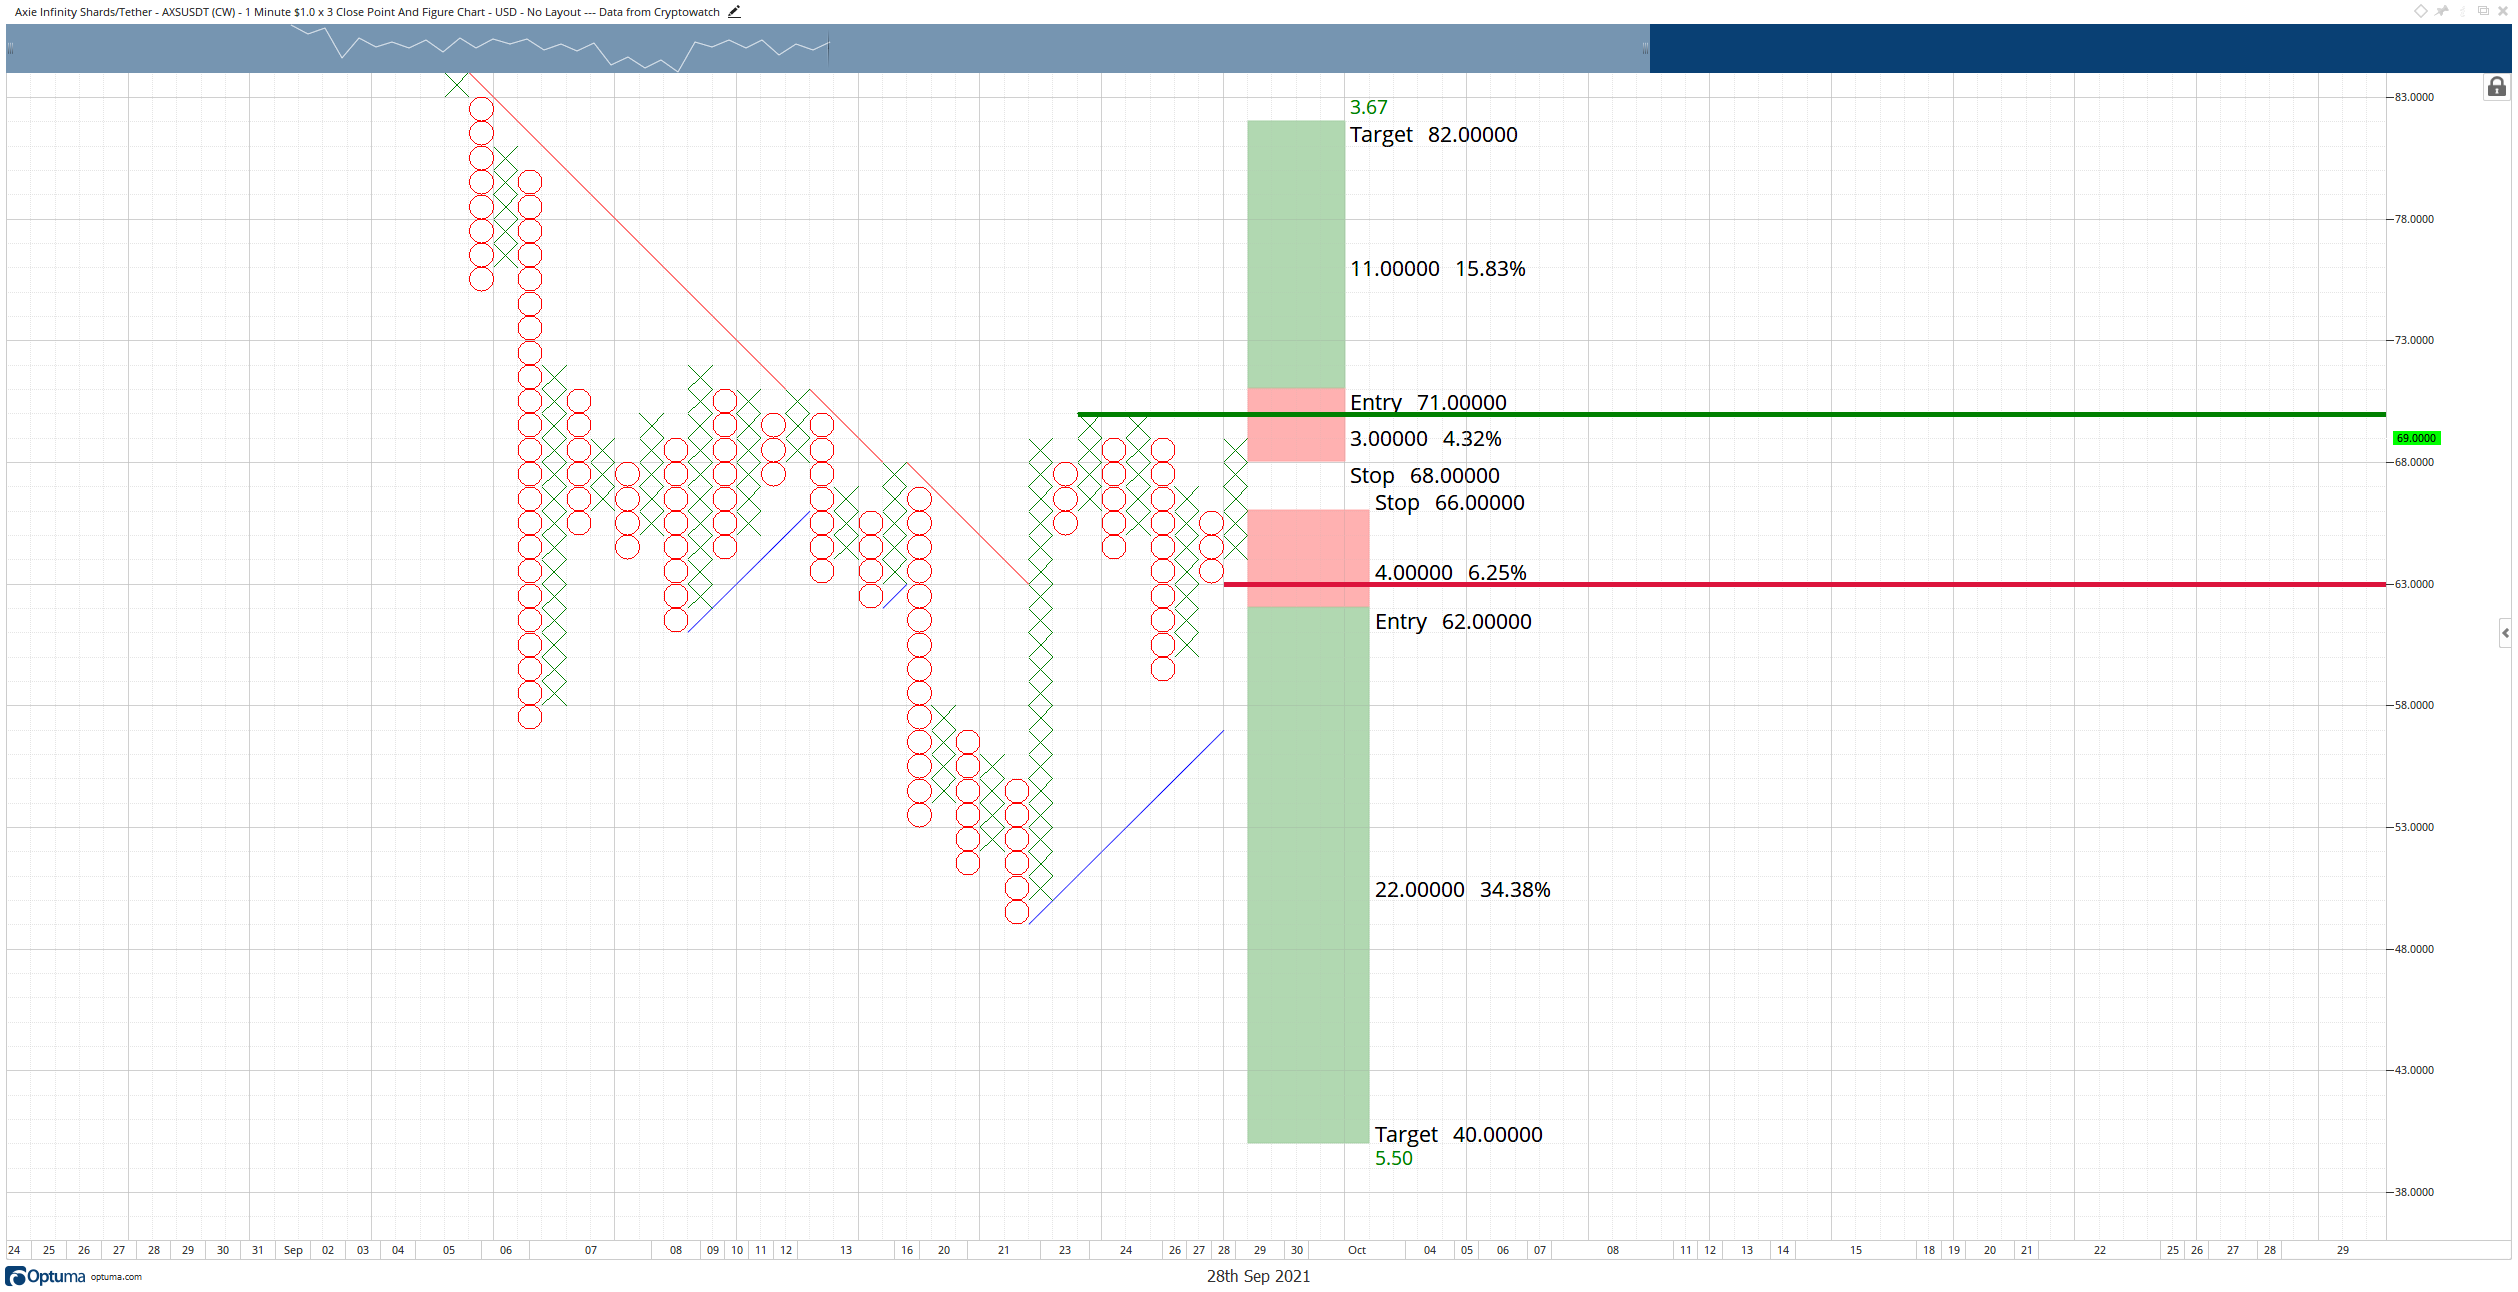
AXS/USD $1.00/3-box Reversal Point and Figure Chart
Another highly sought out pattern by Point and Figure traders is the Bullish Fakeout Pattern. For this pattern to remain valid, Axie Infinity price can’t move above the $69 level. If new O-column prints and forms a double bottom at $63, then a hypothetical entry at $62 would confirm the Bullish Fakeout Pattern. The hypothetical target zone for bears is a massive drop down to $40.


