
-
Bitcoin (BTC/USD) continued to drop after the break below the 38.2% Fibonacci level. But price action managed to reach the 61.8% Fib rather than just the 50% Fib.
-
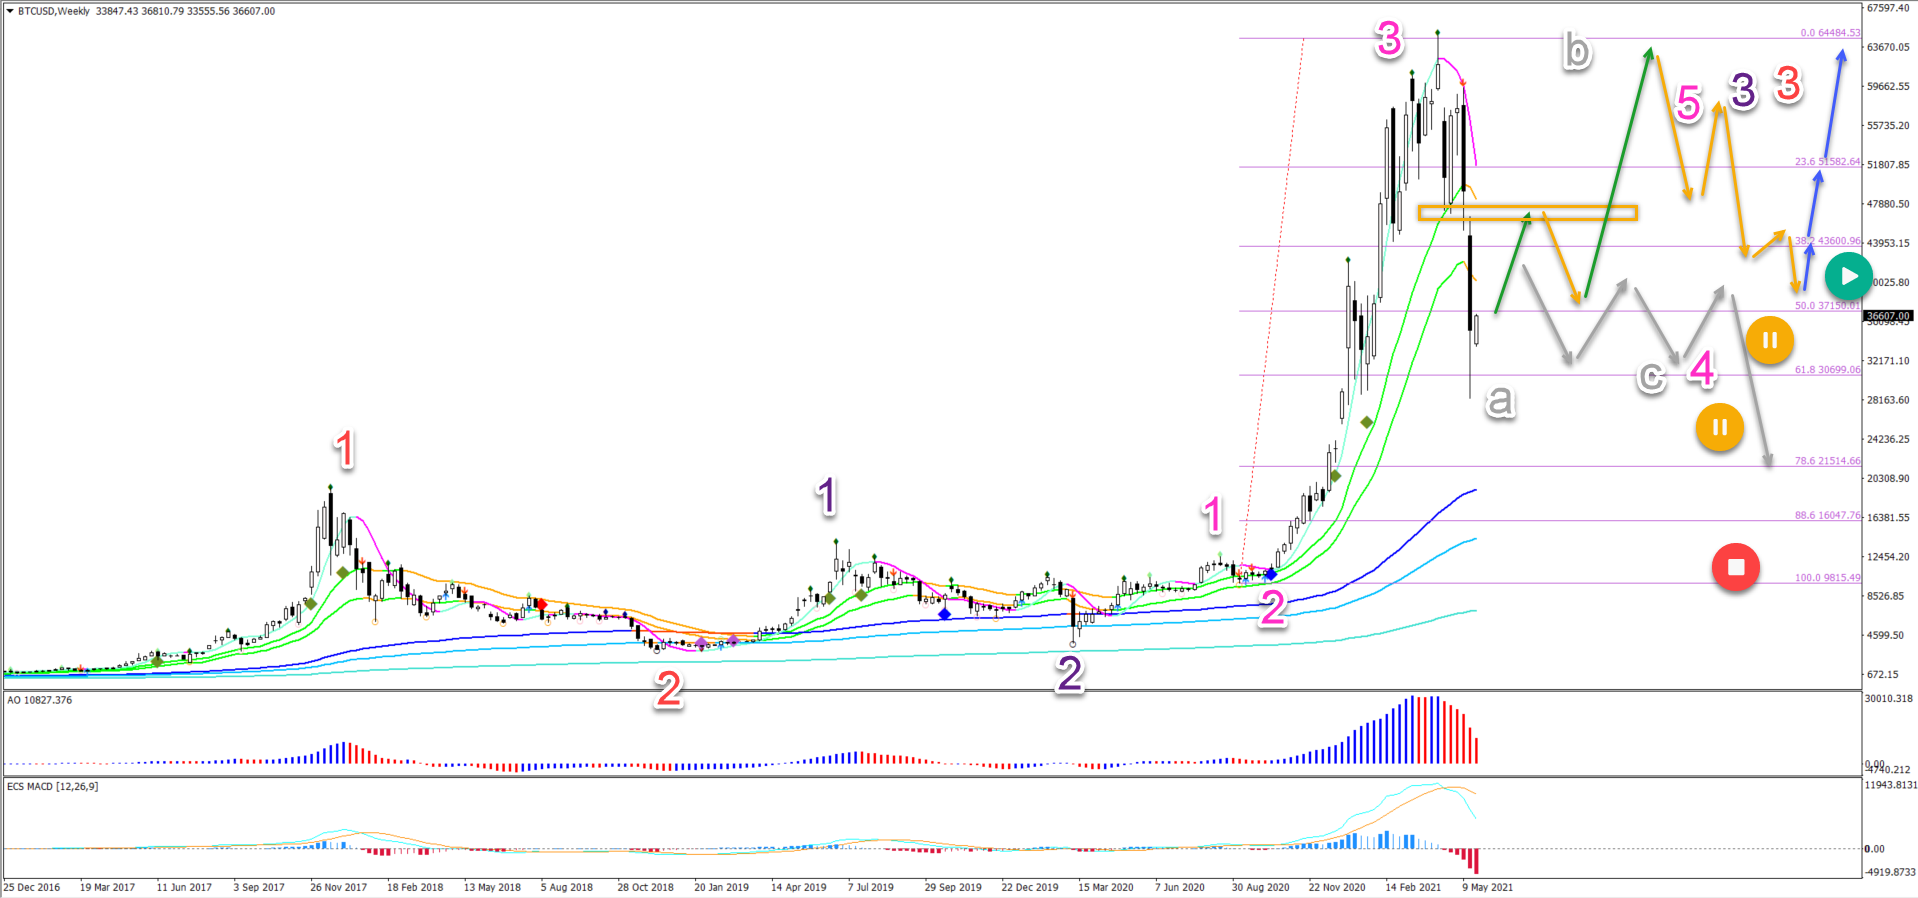
Wave 2 (pink) was very shallow so a deeper retrace now makes sense. Because waves 2 and 4 are usually the opposite in their character (shallow vs deep).
-
The current pullback respected the 61.8% Fibonacci support. This could indicate a bullish ABC (blue) pattern towards the previous bottoms (red box).
This deep decline is unusual for a wave 4 but not illogical in this case. Let’s review the Elliott Wave patterns in more detail.
Price charts and technical analysis
The BTC/USD made a deep retracement in wave 4 (pink). Usually waves 4 retrace only to the 38.2% Fib.
-
But in this case, wave 2 (pink) was very shallow so a deeper retrace now makes sense. Because waves 2 and 4 are usually the opposite in their character (shallow vs deep).
-
Wave 2 was not only shallow but also simple. This means that wave 4 (pink) could also become complex besides being deep.
-
BTCUSD respected and bounced at the 61.8% Fibonacci level. This could indicate the end of the wave A (grey).
-
A bullish bounce (green arrow) could create a retest of the top in wave B (grey).
-
Then another bearish price swing could complete wave C (grey) in wave 4 (pink).
-
Once the ABC (grey) is completed, the wave 4 (pink) could be completed and another uptrend (blue arrows) could start wave 5 (pink).
-
If Bitcoin, however, fails to break above the 21 ema zone on the weekly chart, then the uptrend is probably over (grey arrows).
-
In that case, price action could drop further down after a sideways range.
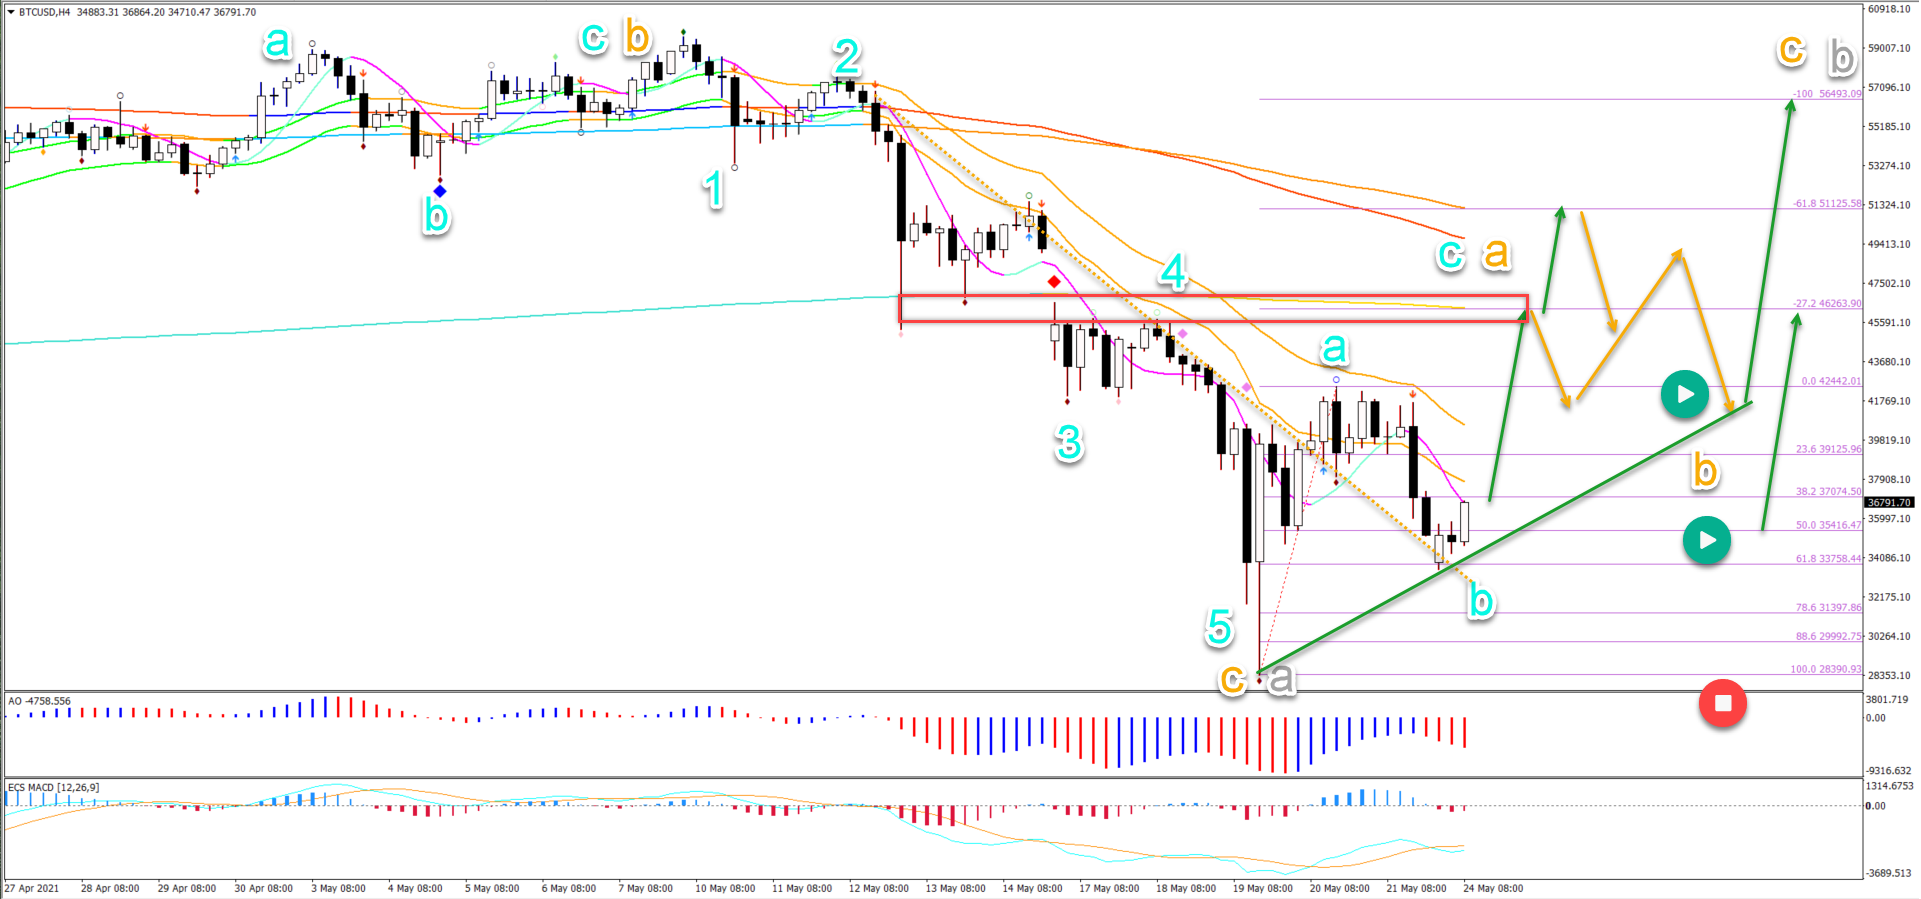
On the 4 hour chart, Bitcoin (BTC/USD) seems to have completed an ABC (blue) in wave B (orange) followed by 5 bearish waves (blue) in wave C (orange):
-
The current pullback respected the 61.8% Fibonacci support.
-
This could indicate a bullish ABC (blue) pattern towards the previous bottoms (red box).
-
The main targets are the -27.2% and -61.8% plus long-term moving averages.
-
A bearish bounce at the target zone could complete wave A (orange) and start wave B (orange).
-
A strong bullish bounce (green arrows) could indicate a wave C up (orange).
-
A break below the bottom invalidates the current wave outlook (red circle).
The analysis has been done with the ecs.SWAT method and ebook.


