
- Bitcoin looks to retest two-month highs above $42,000 en-route 200-DMA.
- Bullish crossover and RSI on the daily chart back the constructive outlook.
- BTC price ignores thr Chinese central bank’s warning amid increased adoption.
Bitcoin has kicked off the August month on the right footing, looking to extend the previous week’s 15% gains amid favorable fundamental and technical catalysts.
The flagship cryptocurrency hit the highest level since May 20 at $42,404 on Saturday, although failed to extend its recent winning streak and ended the day in the red around $41,400 levels.
The retracement in BTC price from two-month highs could be partly associated to profit-taking amid weekly closing. Meanwhile, the People’s Bank of China’s (PBOC) pledge to maintain heavy regulatory pressure on cryptocurrency trading and speculation also may have prompted a pullback in the world’s most favorite digital asset.
However, the upbeat momentum around the granddaddy of cryptocurrencies remains intact amid increased institutional demand and widespread adoption in financial transactions.
Bloomberg reported earlier on, Germany set out a new law, effective August 2, allowing institutional funds to hold up to 20% of their assets in cryptocurrencies.
The BTC price rallied on a rumor that Amazon.com Inc. would soon accept crypto as payment on its platform. Amazon later clarified, the “speculation” about its “specific plan for cryptocurrencies is not true,” but it failed to deter the bullish interests.
Bitcoin price to defy overbought conditions, with more upside in the offing
Looking at the daily chart, the BTC price is gathering pace to initiate a fresh upswing towards the horizontal 200-Daily Moving Average (DMA) at $44,750.
A bull cross, represented by the 21-DMA crossing over the 50-DMA to the upside, favors the bullish potential in BTC price.
However, BTC bulls are likely to face an immediate hurdle at the two-month highs of $42,404.
A sustained move above the latter could put the May 19 flash crash of $43,586 to test on their journey towards the 200-DMA.
The 14-day Relative Strength Index (RSI) remains in the overbought region but has eased off the higher levels, suggesting that bullish grip could likely persist in the near term.
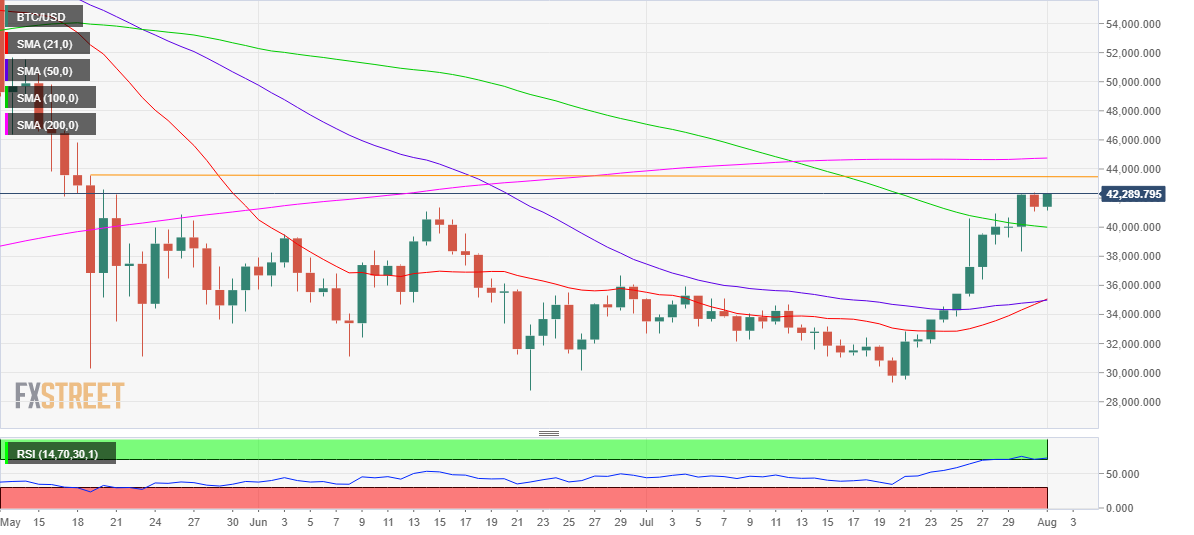
BTC/USD: Daily chart
On the flip side, a drop below Saturday’s low of $41,069 could revive the selling bias, extending the corrective pullback towards the mildly bearish 100-DMA at $39,995.
A daily closing below that level could negate BTC’s upbeat outlook in the short term, exposing the previous week’s low of $38,345.
The next powerful support appears around $35,000, where the 21 and 50-DMAs intersect.


