
- Bitcoin price is ready for a 16% climb, but multiple obstacles could hinder its potential rally.
- The leading cryptocurrency could continue moving sideways in the consolidation pattern until buying pressure increases.
- Investors should pay close attention to $44,248, the upper boundary of the technical pattern.
Bitcoin price continues to record lower highs as a consolidation pattern has emerged. BTC has recovered nearly 9% since the September 24 low, which saw the leading cryptocurrency plunge 10% following China’s reiteration of a harsh crackdown on cryptocurrencies.
Bitcoin price recovery could be tough
Bitcoin price has formed a symmetrical triangle pattern on the 4-hour chart as BTC has formed lower highs and higher lows. The continuation pattern indicates that there is a general equilibrium between buyers and sellers. The heightened level of indecision is clouding directional intentions for the bellwether cryptocurrency.
However, Bitcoin price has approached the upper boundary of the continuation pattern, suggesting that BTC is ready for a breakout if a spike in buy orders materialize.
The governing technical pattern indicates that Bitcoin price could see a 16% bounce toward $51,367. Despite the bullish target, BTC has multiple obstacles ahead, with the first line of resistance at the topside trend line of the chart pattern at $44,248.
The following hurdle for Bitcoin price is at the 38.2% Fibonacci retracement level at $44,692, then at $45,146, where the 100 four-hour Simple Moving Average (SMA) sits.
The descending diagonal trend line will emerge as the next resistance for Bitcoin price at $45,877 before BTC confronts the 200 four-hour SMA at $46,846. Only should the bulls continue to be committed to the leading cryptocurrency’s recovery could the coin tag the 61.8% and 78.6% Fibonacci retracement levels at $47,814 and $50,0237, respectively.
Currently, the Arms Index (TRIN), which gauges overall market sentiment, has a reading of less than 1.0, which indicates that there are more market participants buying than selling Bitcoin.
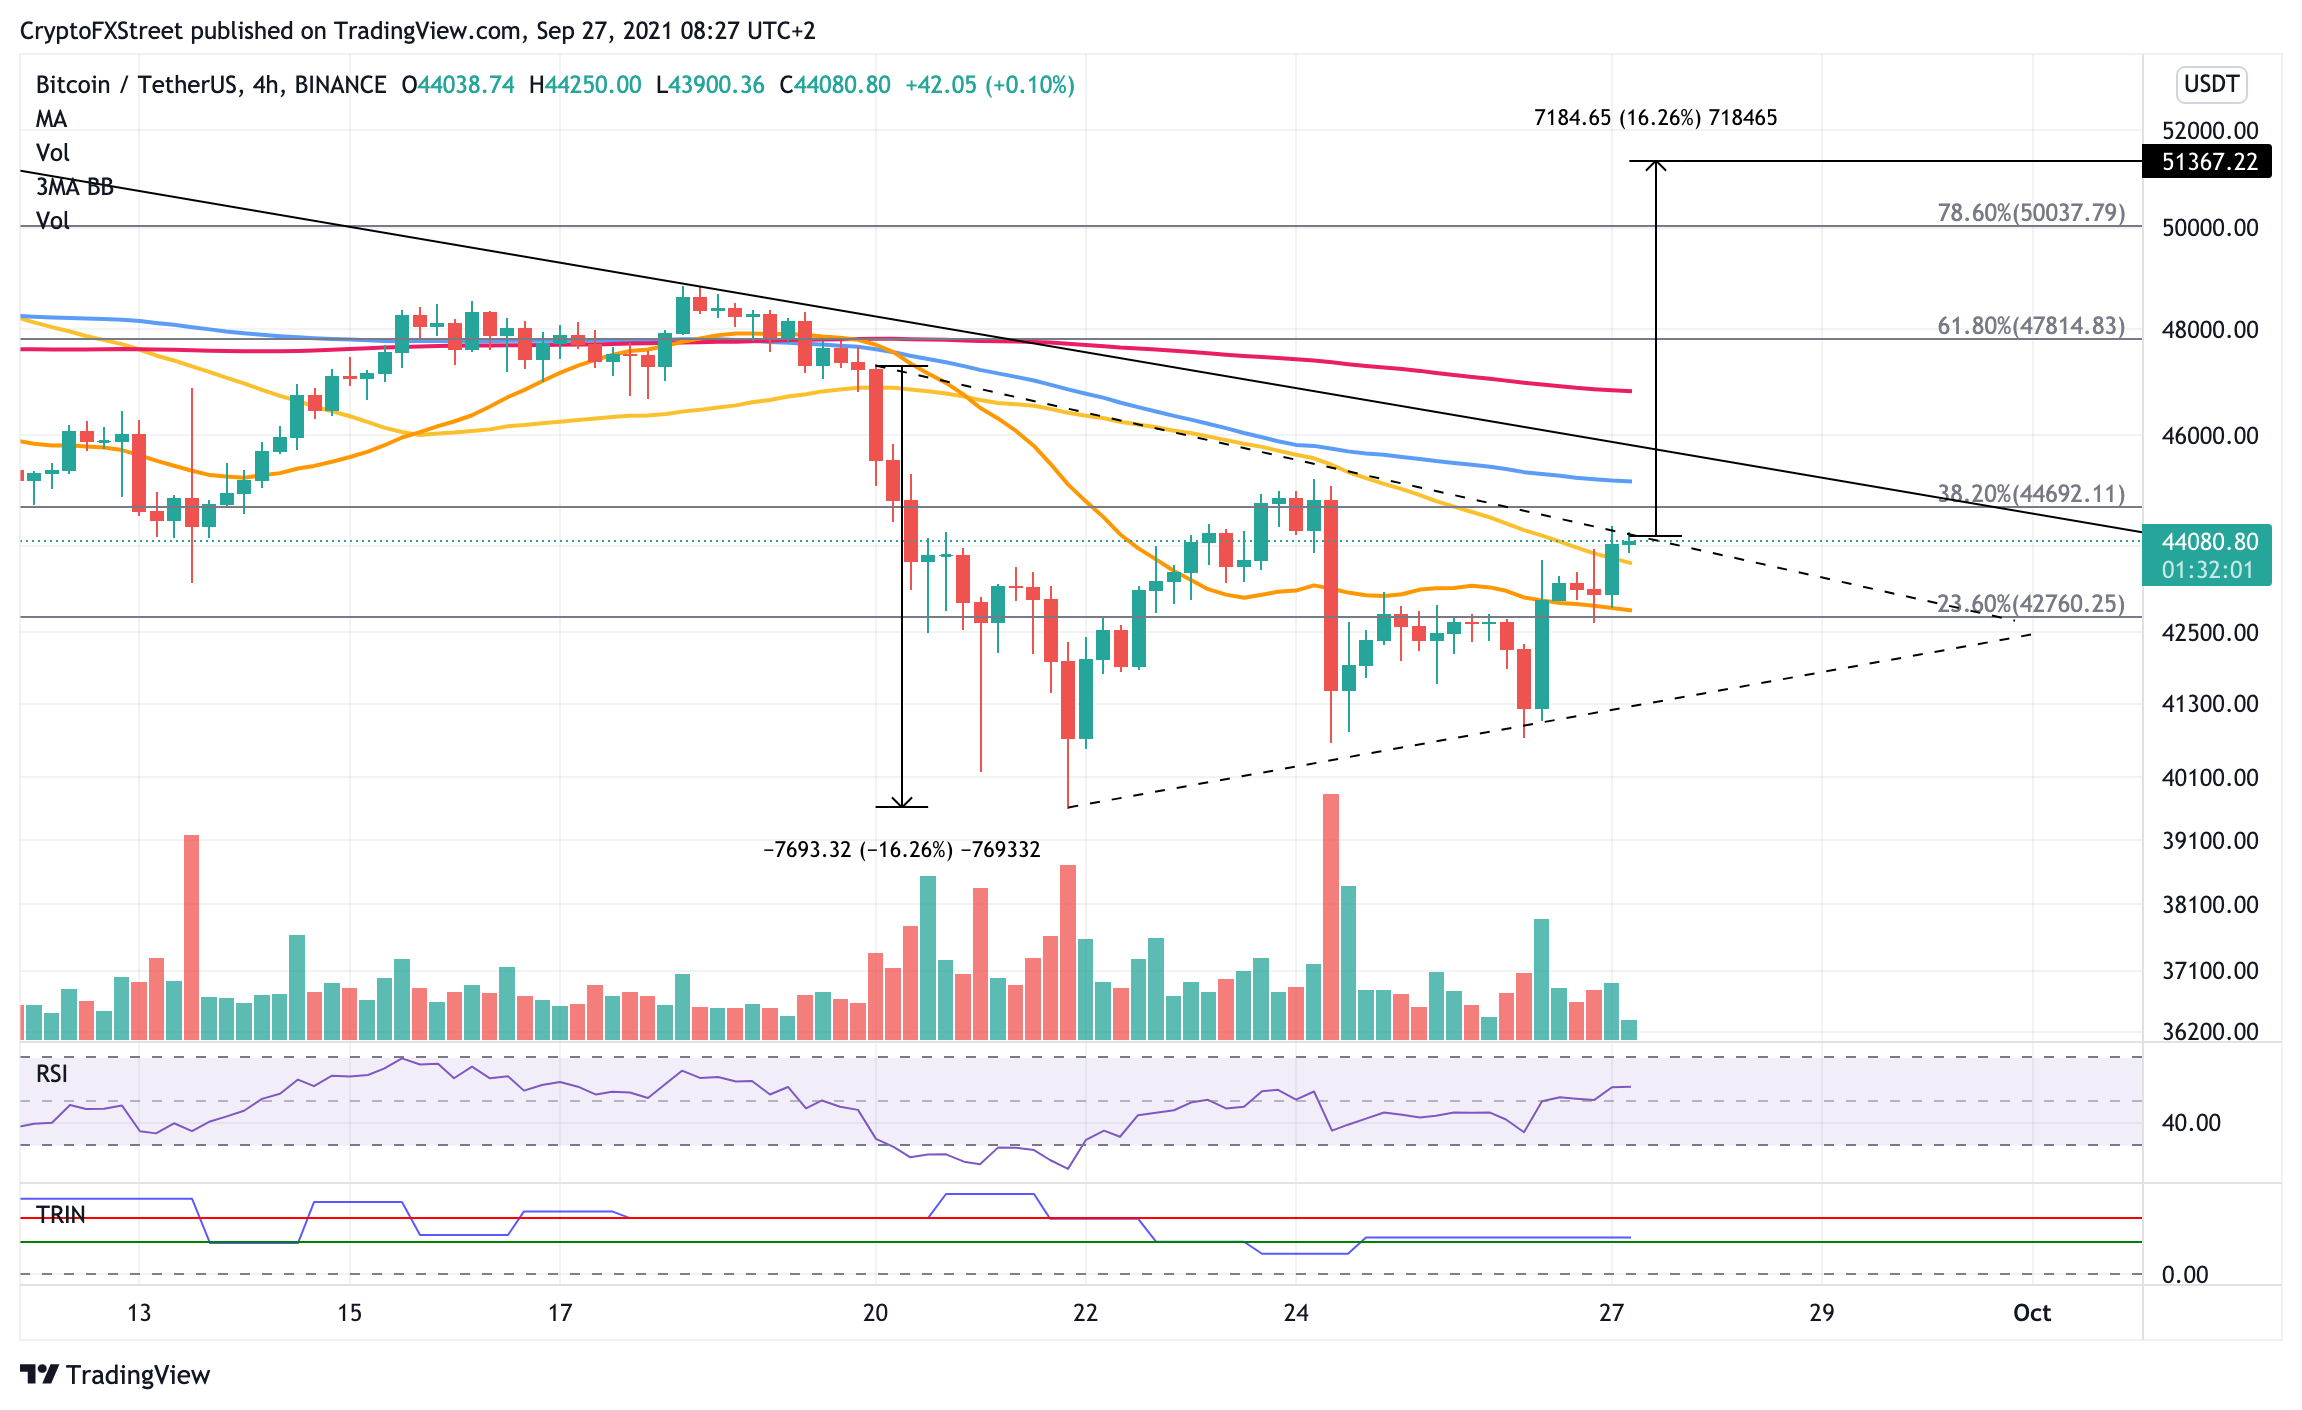
BTC/USDT 4-hour chart
Should sufficient buying pressure incentivize Bitcoin price to climb above the aforementioned obstacles, BTC would then be able to reach the bullish target at $51,367.
Given the number of obstacles in the way of the bellwether cryptocurrency’s recovery, Bitcoin price may reverse and test crucial levels of support.
If Bitcoin price encounters increased selling pressure, the leading cryptocurrency would find immediate support at the 50 four-hour SMA at $43,683. The following line of defense would emerge at $42,760, where the 23.6% Fibonacci retracement level and 20 four-hour SMA collide.


