
-
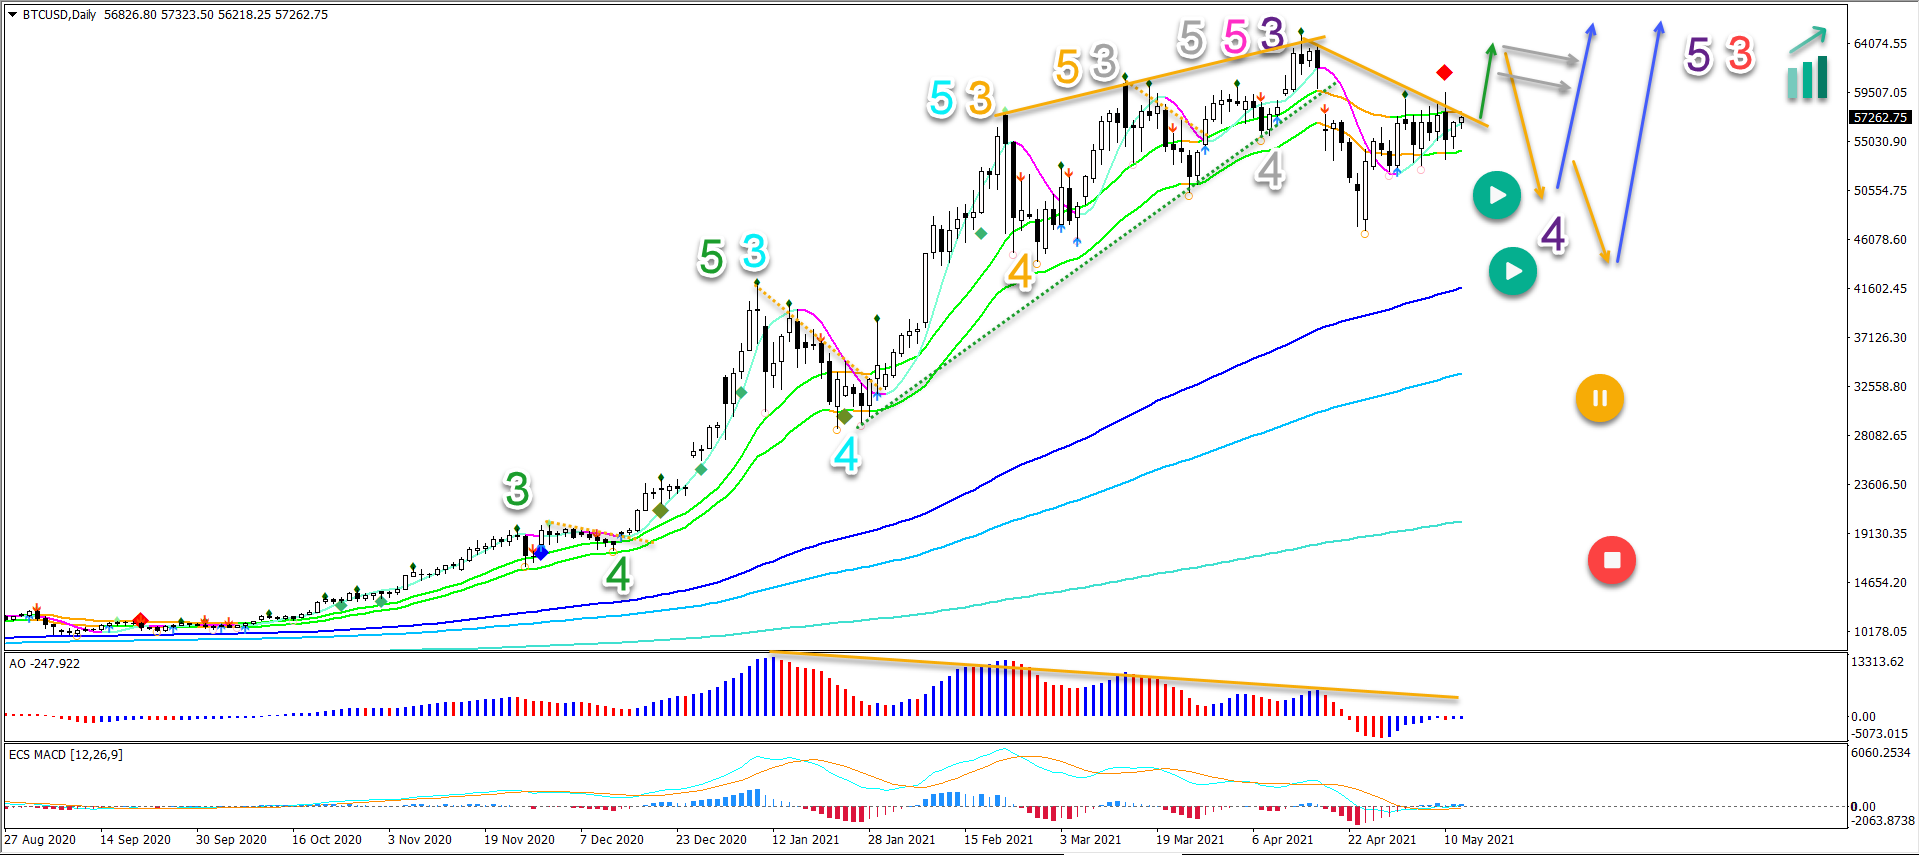
Bitcoin made a first bearish break below the 21 ema zone since September 2020. But signs of the overall uptrend remain strong with all the moving averages aligned.
-
The strong push above the 21 ema is typical for a wave 3 (purple). This means that the bearish breakout below the 21 ema zone is probably a wave 4 (purple)
-
A continuation pattern like a bull flag (grey arrows) could indicate an immediate uptrend (blue arrow). The next targets could aim at the $75-80k levels.
This article reviews the key Elliott Wave patterns and chart patterns. We also analyse what to expect next in the path of least resistance.
Price charts and technical analysis
So far, price action has indeed completed the bearish pullback as expected in our previous analysis. The strong push above the 21 ema is typical for a wave 3 (purple). This means that the bearish breakout below the 21 ema zone is probably a wave 4 (purple):
-
The wave 4 (purple) outlook remains valid as long as price action stays above the 144-233 emas on the daily chart.
-
A break below these emas could pauze (orange button) or invalidate it (red button).
-
The large space and gap between the short-term moving averages and the long-term moving averages also indicates a strong uptrend.
-
Now price action is back inside the 21 emas. A bullish breakout above the 21 emas (green arrow) could either indicate a) an uptrend continuation or b) a larger wave 4 correction.
-
A 2nd break below the 21 emas could indicate a pullback (orange arrows). But eventually a larger uptrend is expected (blue arrow).
-
A continuation pattern like a bull flag (grey arrows) could indicate an immediate uptrend (blue arrow).
-
The AO bars have reached the middle line after a series of lower highs. This could help confirm the wave 3-4 (purple) analysis.
-
The next targets could aim at the $75-80k levels.
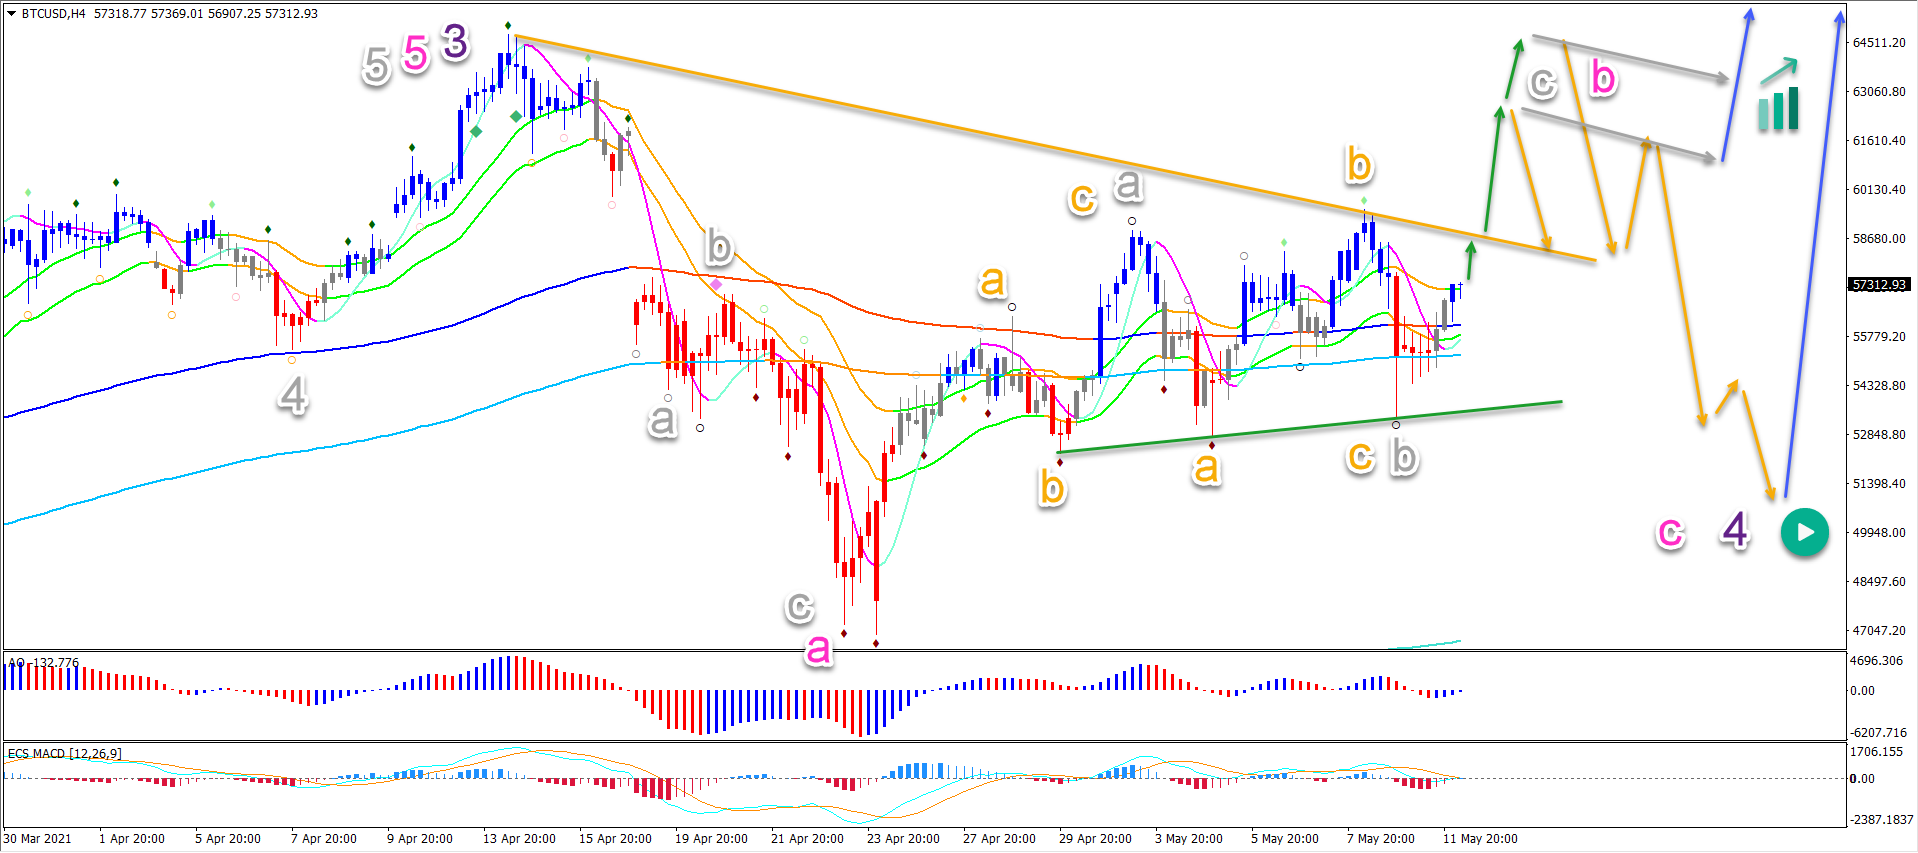
On the 4 hour chart, price action seems to be slower in recent weeks. This could be explained by the corrective nature of a wave 4 (purple):
-
A larger ABC (pink) pattern could be developing within wave 4 (purple).
-
A bearish ABC (orange) seems to complete wave B (grey).
-
A bullish wave C (grey) could complete wave B (pink).
-
A bearish bounce (orange arrows) could see price test the bottom again.
-
A bullish bounce (blue arrow) could complete ABC (pink) in wave 4 (purple).
-
A flag pattern (grey arrows) could indicate more upside (blue arrow) rather than a deeper correction.
The analysis has been done with the ecs.SWAT method and ebook.


