
- Bitcoin price has breached a crucial support level at $21,535 but currently sits above a relatively stable barrier at $19,540.
- From a long-term perspective, things are still bearish and could revisit the range low at $17,585.
- A daily candlestick close above $24,989 will invalidate the bearish outlook and trigger a recovery rally.
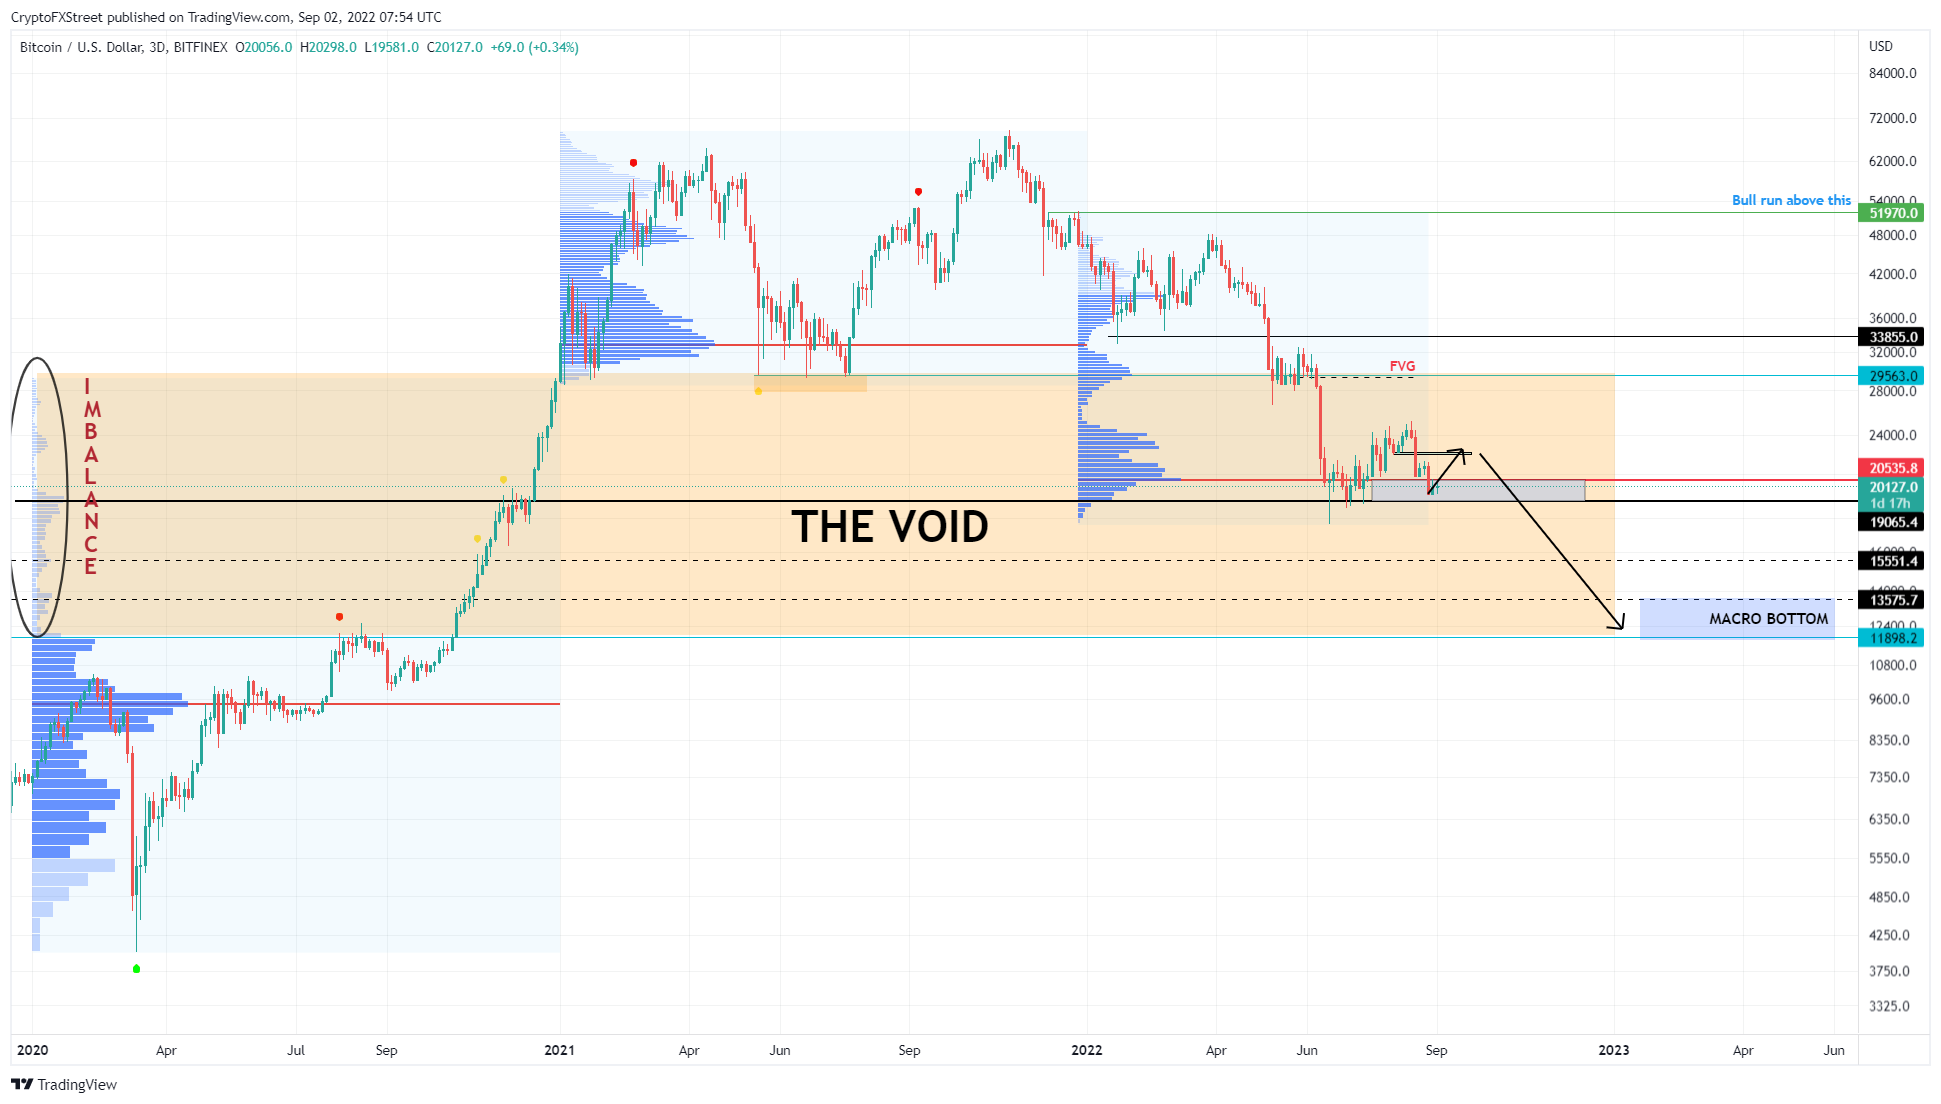
Bitcoin price shows an ongoing consolidation as it hovers at the same level for the past six days with no signs of directional bias. A breakout from this tightening range could result in a bearish move that eyes a sweep of the sell-stop liquidity below recent lows.
Bitcoin price at inflection point
Bitcoin price shows tight consolidation after it recently broke out of another range-bound movement on August 26. This crash has pushed BTC below the point of control (POC) at $21,535, which is the highest traded volume level since 2022.
Due to the bearish outlook in the crypto markets, if buyers fail to step in, it will result in another leg down that pushes Bitcoin price to the range low of $17,585. This 12% downswing could be met by buying pressure from investors looking to purchase BTC at a discounted price.
BTC/USDT 1-day chart
From an on-chain perspective, this bearish outlook is likely to occur sooner rather than later. IntoTheBlock’s Global In/Out of the Money (GIOM) model shows that the immediate support level at $18,925 is weak relative to the resistance cluster at $23,629.
The former only contains 673,210 addresses holding 421,840 BTC, while the latter cluster contains 2.73 million BTC purchased by roughly 4.41 million addresses. This outlook suggests that a downswing is more likely to occur, especially if there is a sudden spike in selling pressure.
Interestingly, the next support cluster extends from $9,470 to $17,945, where nearly 5 million addresses purchased 1.67 million BTC at an average price of $11,881. Therefore, a breakdown of $18,900 could result in a steep correction to levels last seen roughly two years ago.
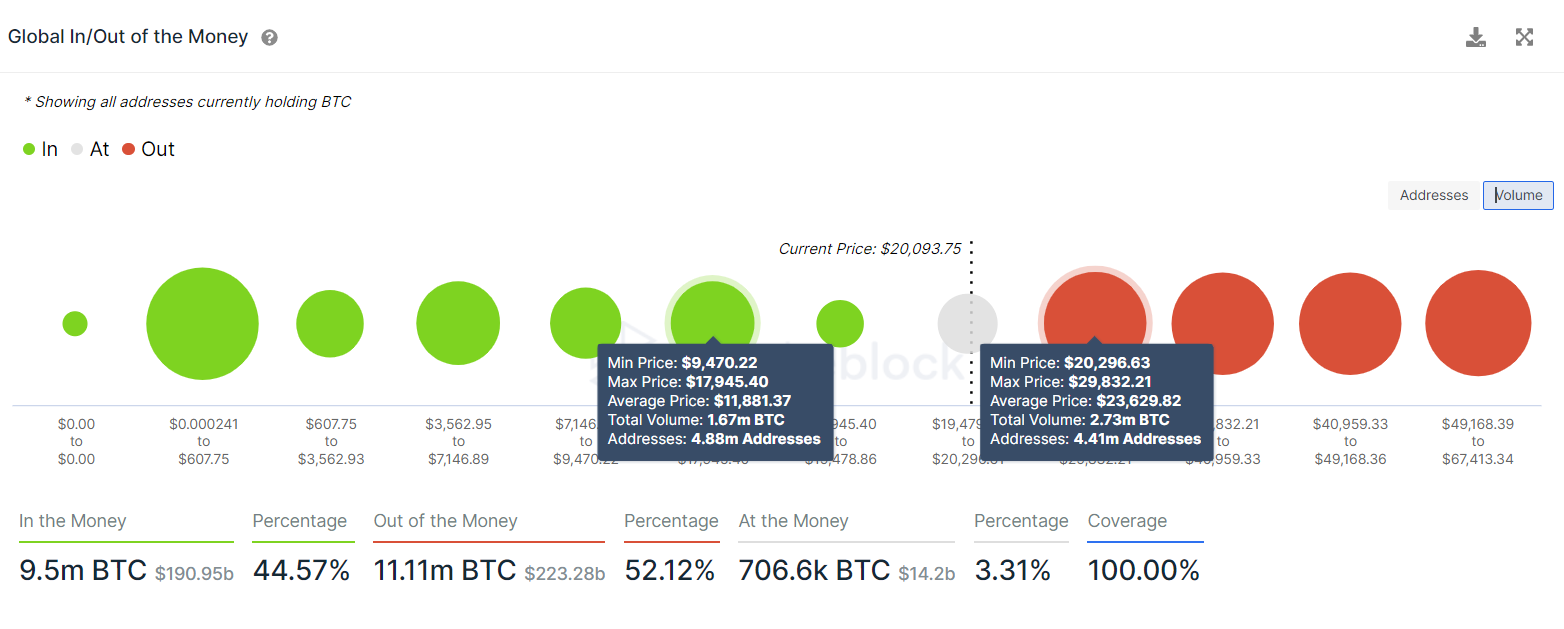
BTC GIOM
However, the bearish outlook could be sidestepped if bulls make a comeback at the current level. The first confirmation of an uptrend or a recovery rally would come from Bitcoin price flipping above the POC at $21,535, as seen in the chart above.
Additionally, the one-hour chart shows that Bitcoin price is yet to collect the buy-stop liquidity resting above equal highs formed at $21,874. A sweep below the $19,511 level could, therefore, provide the needed buy signal that could potentially forecast a move to the liquidity just above $21,874.
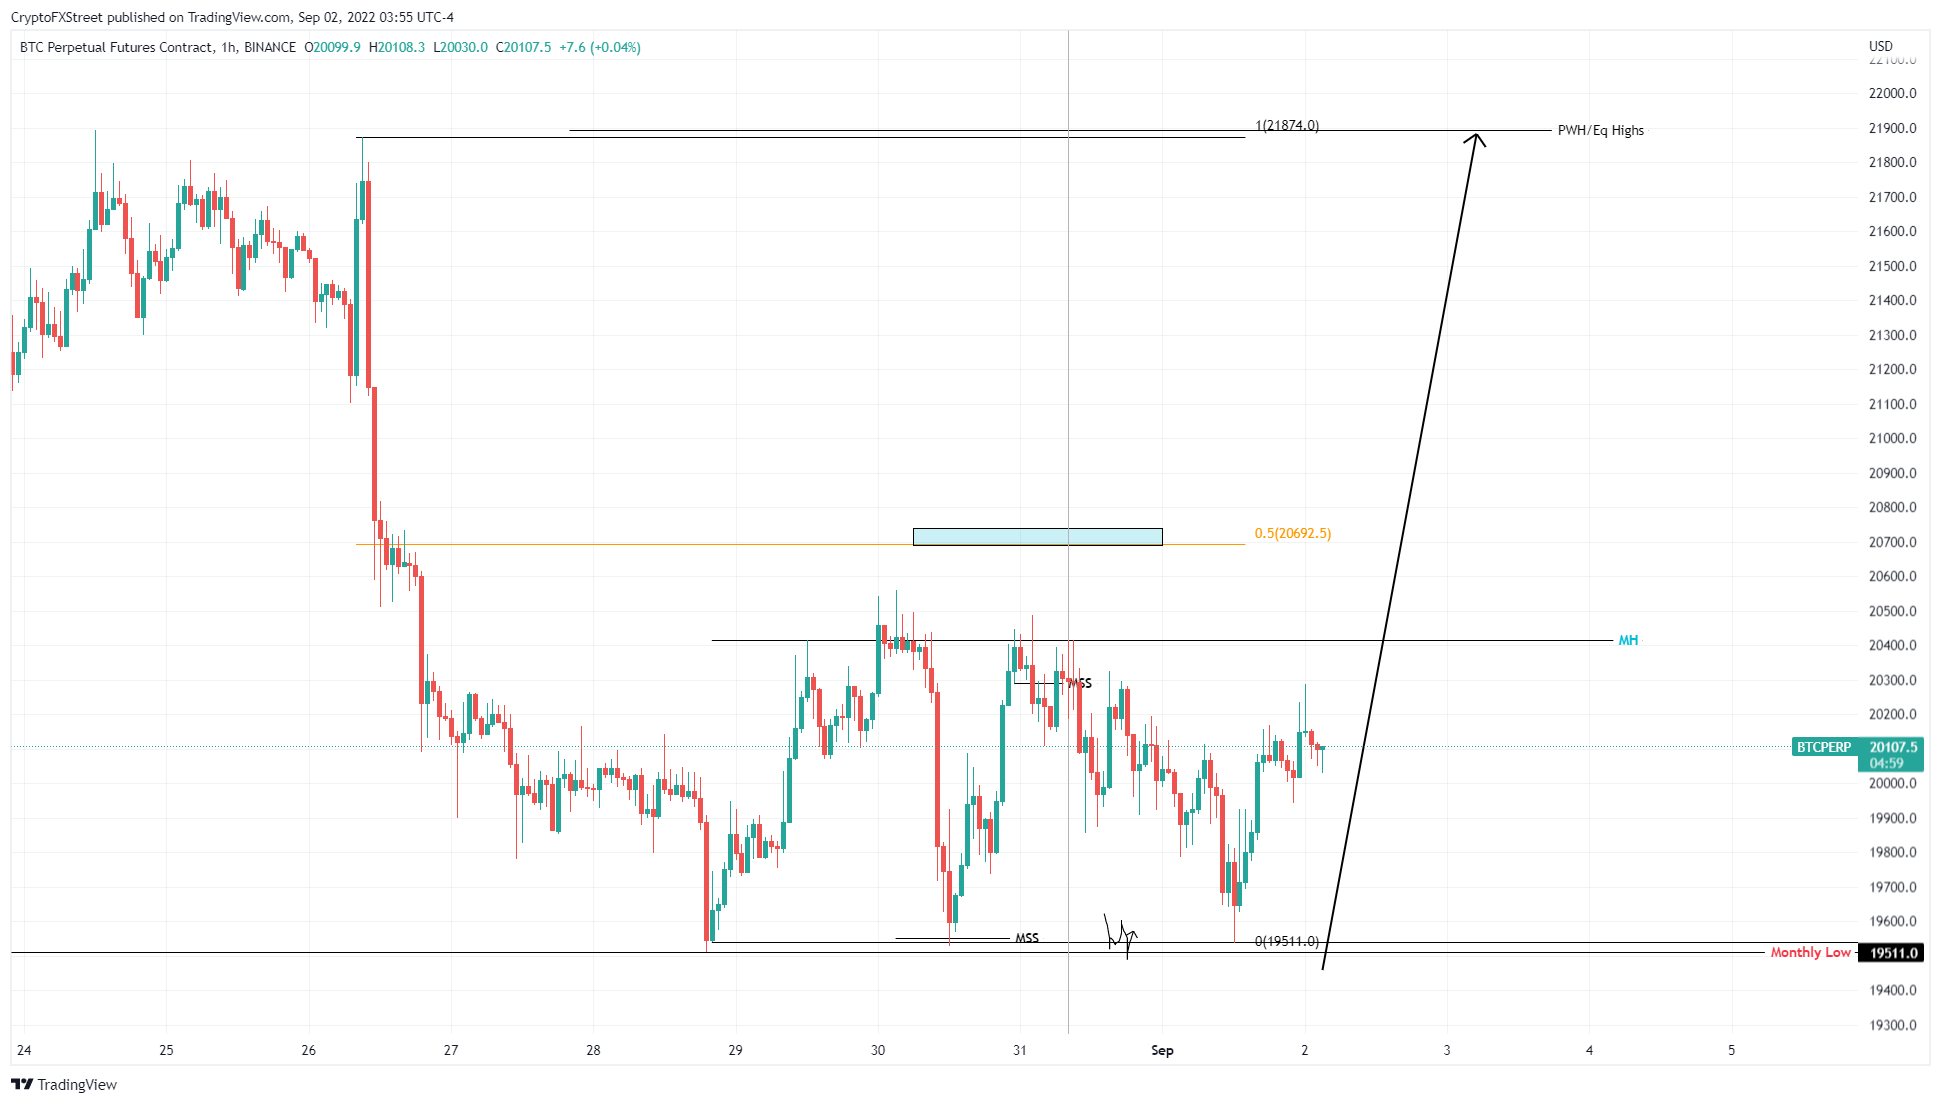
BTC/USDT 1-hour chart
On the other hand, if Bitcoin price fails to hold above the $18,900 level, on-chain metrics forecast a 36% crash to $11,881. Interestingly, this level coincides with the technical outlook, which forecasts a crash to the support level at $11,898.
Note:
The video attached below explains the potential outcomes Bitcoin price could go through from a short-term and long-term perspective.


