
- Bitcoin price is struggling to slice through the $46,000 resistance barrier, suggesting a pullback.
- Adoption across different countries continues to make headway after the recent upswing.
- On-chain metrics point to a short-term bearish outlook but remain bullish on a long-term scenario.
Bitcoin price has struggled to slice through a crucial resistance level for over four days. This stagnation has pushed BTC and the altcoins to lose momentum and flash a warning signal of an incoming pullback.
Going forward, investors need to pay close attention to the rally as there is a high probability this upswing that originated on July 20 might need to take a breather.
Adoption all the way
Despite May 19 and subsequent crashes, Bitcoin adoption continues to progress. From becoming a legal tender in El Salvador to multiple ETF applications, BTC has risen higher. The most recent step in this direction is the President of Argentina, Alberto Fernandez, expressing his views on how Bitcoin can combat inflation with a local media outlet on August 12.
The President stated his interest in the big crypto, illustrating the recent development in El Salvador and articulated the reason for his decision as “combating inflation.”
Argentina has long suffered the adverse and rampant effects of inflation of its currency, which makes digital assets like Bitcoin a viable option. However, due to the burgeoning nature of the cryptocurrency ecosystem, he remains cautious of BTC.
In a similar stride, Singapore’s largest bank, DBS Bank, announced on Thursday that it received a ‘go’ sign from the Monetary Authority of Singapore (MAS) to digitize payment token services as a payment institution via its broker arm, DBS Vickers (DBSV). This development makes DBSV one of the new financial institutions to receive approval, and once licensed, the bank will be able to “support asset managers and companies to trade in digital payment tokens through DDEx, an exchange launched in 2020 that allows trading of BTC, ETH, XRP and BCH for institutional investors.”
While countries in the East are taking a much calmer approach, the US has yet to approve any number of the Bitcoin exchange-traded funds (ETF) submitted. Valkyrie Digital Assets, an alternative financial services firm, has become the latest company to apply for a Bitcoin ETF.
Lastly, Coinbase’s Q2 earnings sit around $2.3 billion, roughly 27% higher than Q1 earnings, which is a bullish sign for both Bitcoin price and its stock. This narrative lines up perfectly with massive BTC outflows of significant exchanges.
Bitcoin price at make or break point
Bitcoin price has been struggling with the $46,000 resistance level for roughly four days now but has failed to shatter it. However, the latest attempt has already pierced it, but only a decisive daily candlestick close above it will confirm the flip of this barrier into a support level.
Regardless, investors can expect a minor retracement to arise here due to the extent of the rally, which originated roughly 23 days ago, on July 20. This correction will allow the bulls to regain strength and onboard the sidelined investors to kick-start a new leg-up.
The support levels at $41,333 and $40,550 are the contenders likely to absorb the incoming flurry of selling pressure. If the current rally is bullish, the pullback should reverse around the barriers mentioned above to create a lower low. The resulting upswing will burst through $46,000 and target the next significant psychological level at $50,000.
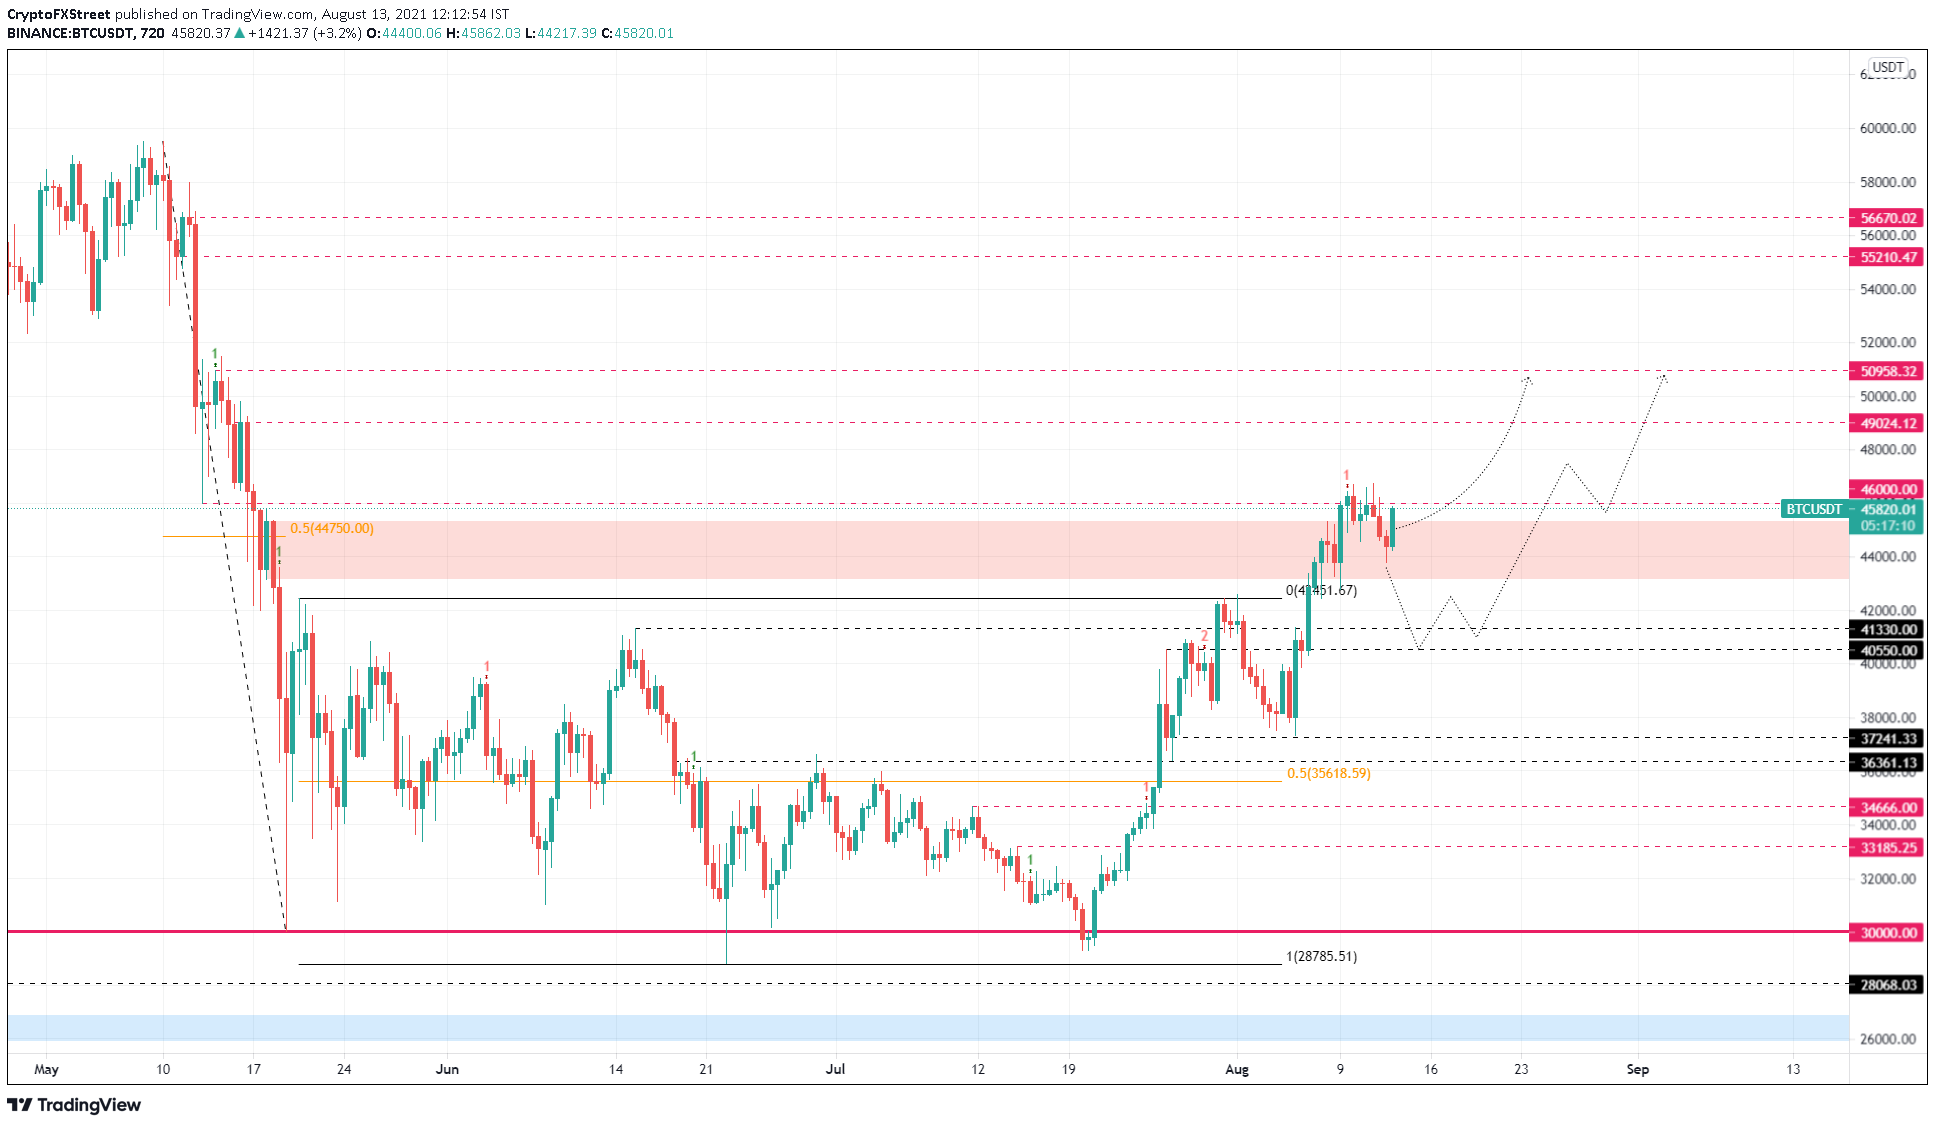
BTC/USDT 12-hour chart
The 30-day Market Value to Realized Value (MVRV) model supports the minor retracement, which has hit 20%. This indicator is used to determine the average profit/loss of investors that purchased BTC over the past month. Currently, 20% of the investors are holding profitable trades and might book these gains, pushing BTC lower.
Interestingly, this fundamental index saw a 20% increase on March 13 after BTC rose from $47,555 to set up a new all-time high at $61,243. This sudden uptick in MVRV saw a $10,000 crash in BTC price over the next two weeks.
Although a similar move might not occur, investors should exercise caution and expect a minor correction to occur.
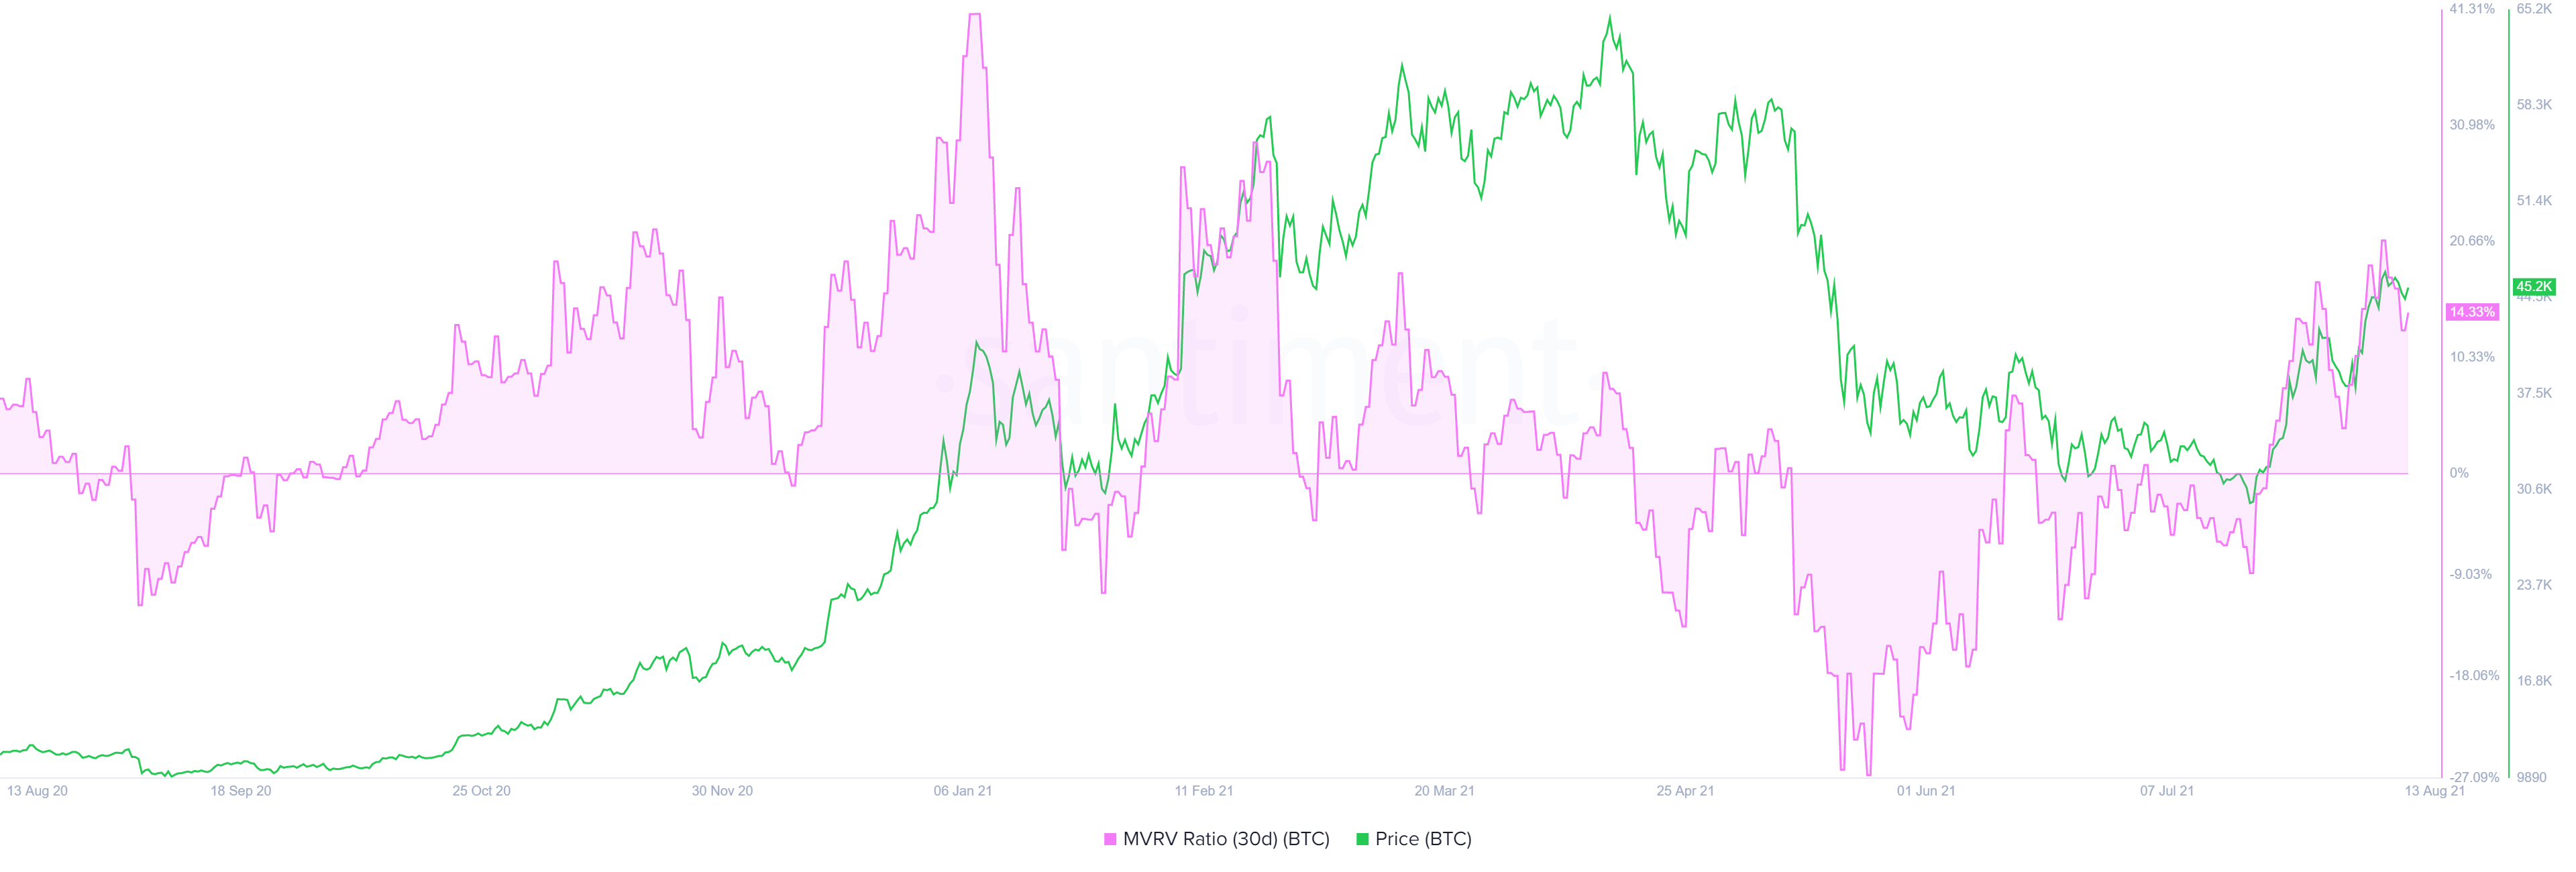
BTC 30-day MVRV chart
The daily active addresses (DAA) metric corresponds to the short-term bearish outlook since it holds steady around 900,000. Despite the increase in BTC from $29,000 to $46,000 in less than a month, this on-chain index still stands below 1 million, indicating that a full-fledged comeback is yet to occur.
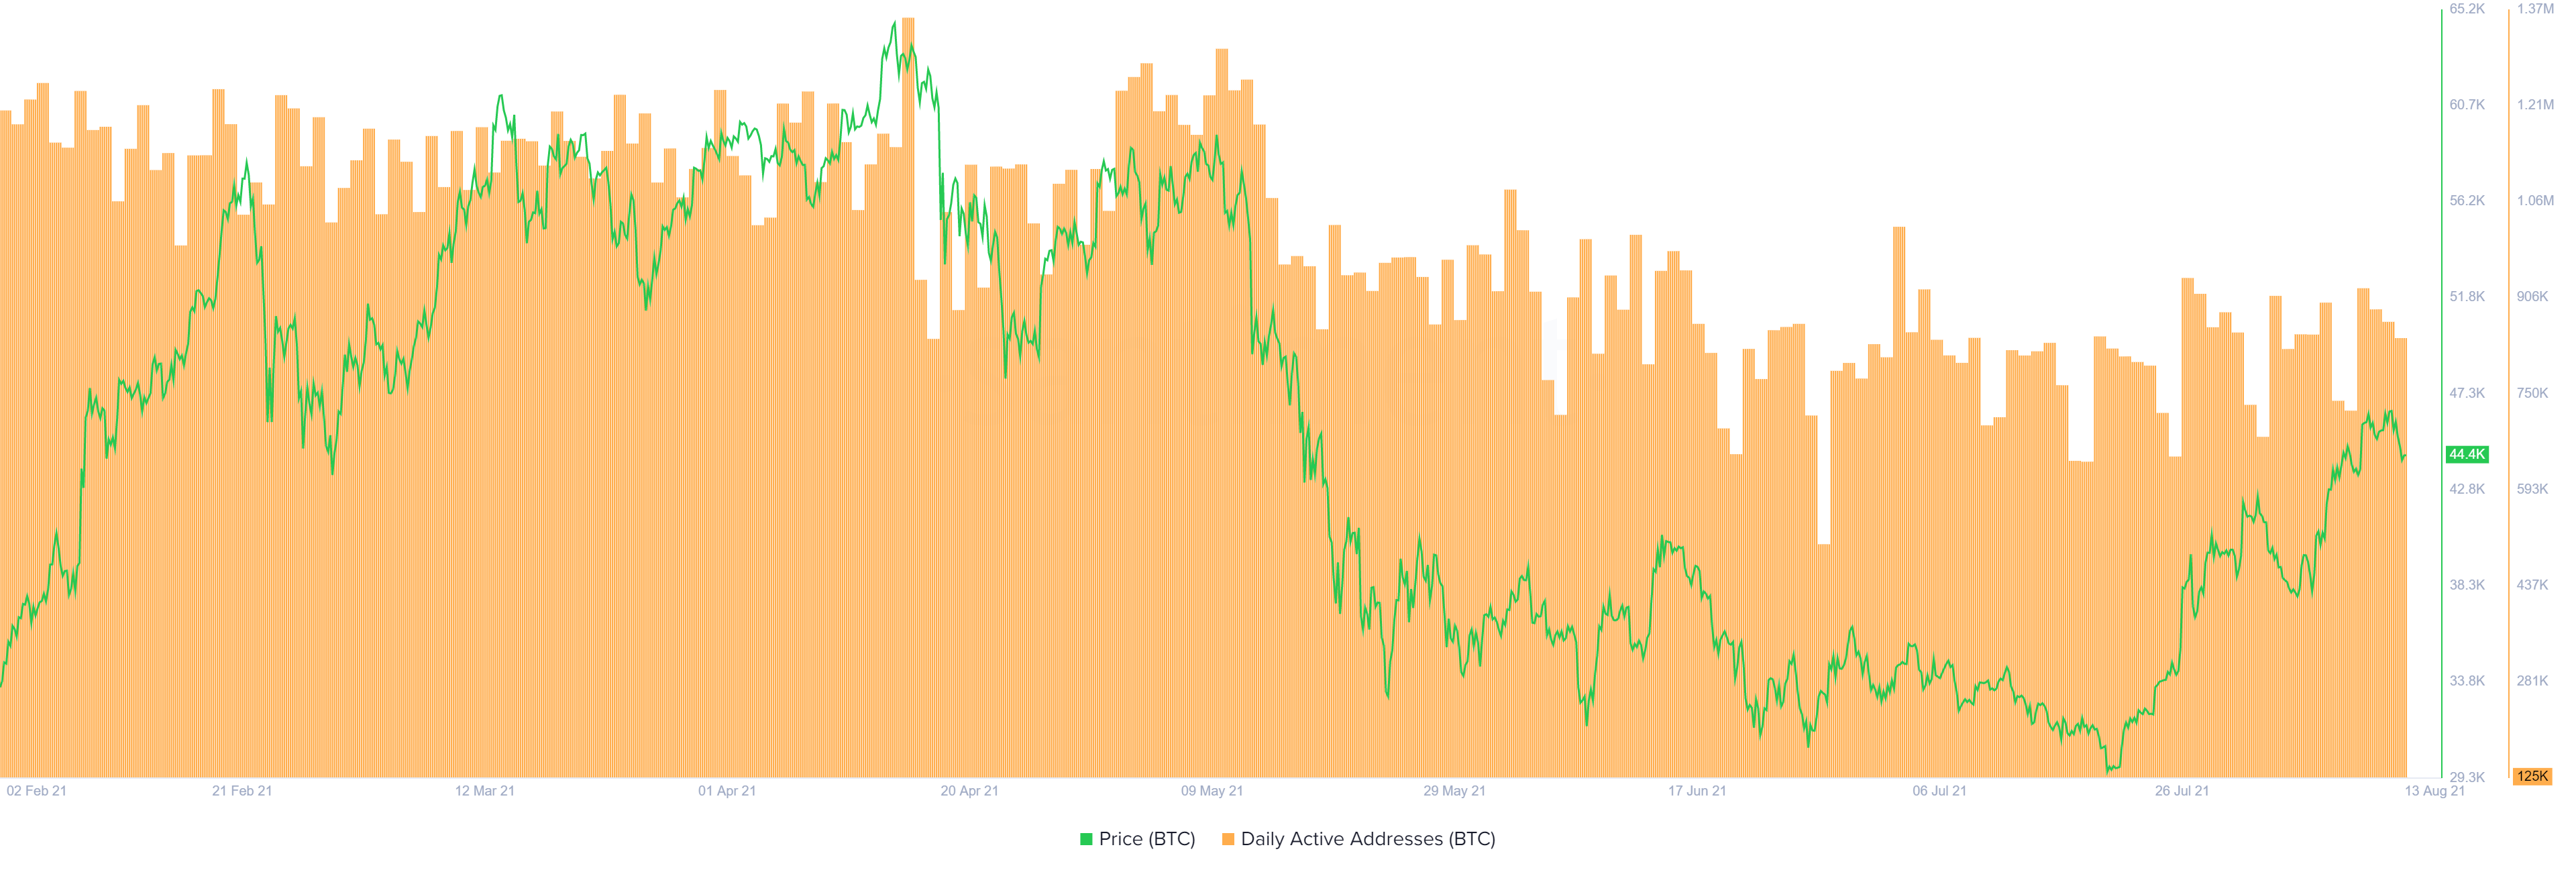
BTC DAA chart
The Stable Coin Supply Ratio (SSR) is obtained by dividing the total BTC market capitalization by the aggregated market capitalization of stable coins. A reduced SSR indicates an excess of stablecoins, which can be a proxy for buying power and thus a bullish indication.
While this index saw a stark decrease from 14 to 9.14 between May 19 and July 19, lately it has risen to 13. This 42% increase indicates that the stablecoin supply has reduced, which is a slightly bearish sign, further supporting the narrative of a pullback.
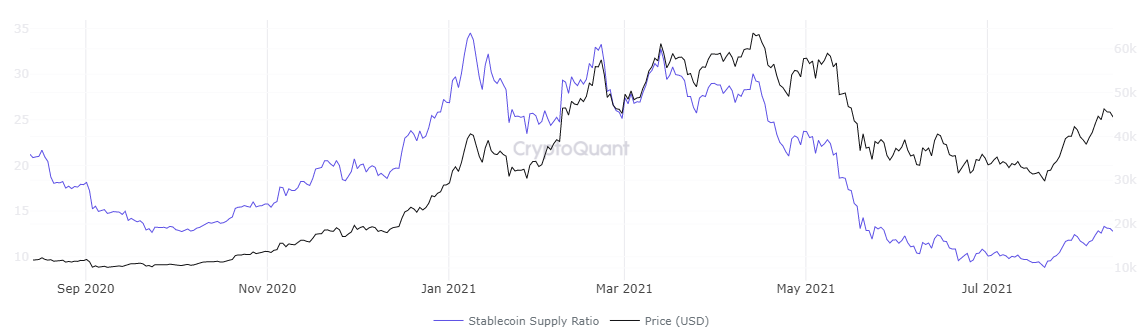
BTC SSR chart
The exchange reserve metric shows a 3% reduction in BTC held on exchange from 2.53 million on July 26 to 2.44 million BTC as of this writing. This decline points to the short-term correction thesis being short-lived and that Bitcoin price remains bullish as investors continue to pull their holdings from centralized entities as they believe in the long-term price performance of the big crypto.
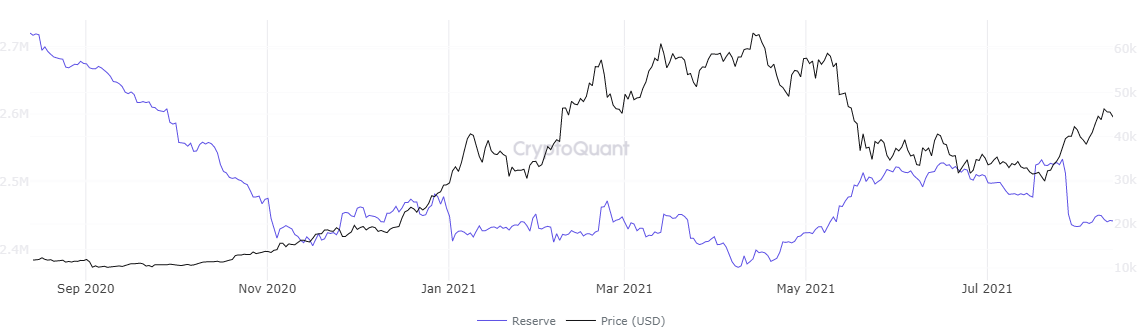
BTC exchange reserve chart
Therefore, market participants can expect the downswing to lead to an uptrend that slices through the intermediate barriers and hits $50,000. However, eventually, Bitcoin price is likely to take a jab at retesting the all-time high at $64,854 and even setting up a new one.


