
- Bitcoin price is experiencing a slow down after the October 21 flash crash.
- A decisive close below the weekly open at $61,574 is likely to trigger a crash.
- Some on-chain metrics reveal the overheated nature of the market, supporting the short-term corrective outlook.
Bitcoin price took off as rumors of an ETF approval gained momentum. Following the trading of the first Bitcoin ETF on the New York Stock Exchange (NYSE), BTC price shattered its previous all-time high and made a new one. While this run-up returned 70% from September 21, things might now slow down briefly before the next leg-up.
Adoption that is tangible and palpable
On October 21, ProShares’ Bitcoin futures ETF (BITO) debuted on the NYSE. While the regulators had delayed the approval since 2017, things have improved considerably in 2021, from real institutional adoption to approval of Bitcoin ETF, albeit one that is based on futures.
After its successful debut, the trading volume of the product hit $1 billion. If this was not enough, the second day also saw it reach $1 billion, indicating the high level of demand from interested investors.
While this is a good sign, there is a 2,000 contracts monthly limit set by the Chicago Mercantile Exchange and so far, ProShares’ ETF has already sold 1,900 contracts for October.
Additionally, Invesco Ltd., another contender in the ETF race, dropped out hours before ProShares’ ETF launch. However, Valkyrie did not budge, and its futures ETF (BTF) is launching on October 22.
While the ETF craze is palpable, Walmart is partnering with Coinstar and CoinMe to install Bitcoin ATMs across the country. The kiosks that allow users to buy Bitcoin are growing rapidly due to the recent run-up from $20,000 to $64,000. Walmart’s decision could be in preparation for the start of a new leg-up.
Although the company did not provide any timeline for completing the kiosks, it added that it has plans to push the number to 8,000.
The most interesting development of the week comes from financial institution JPMorgan, whose analysts suggest that Bitcoin’s recent rally is driven largely by inflation concerns and not ETFs.
The analysts say that the hype surrounding BITO or BTF is not enough to push Bitcoin price higher, rather, it is the shift of investors from gold to BTC – as the former failed to respond in its role as the traditional hedge against rising cost pressures – that drove BTC higher.
Bitcoin price runs out of breath
Bitcoin price rose a whopping 79% between September 21 and October 20. As impressive as this rally is, BTC might be preparing for a correction due to two reasons.
Bitcoin price broke the all-time high at $65,163 and even produced a daily close above it, however, this move was followed by a swift rejection as the next day saw a 5.8% decline. This rejection indicates profit-taking is taking place.
The position of Bitcoin price suggests it is conducive for a double top formation, which is a top reversal pattern.
While these are the two main reasons why BTC is ready for a correction, the declining hype around Bitcoin ETF and significant gaps in the Volume Profile indicator shows that BTC is due for a pullback.
The volume profit for Bitcoin price action from May to October 22 shows gaps around $60,000 psychological barrier and $53,000. Therefore, a decisive close below the weekly open at $61,574 will confirm weakness among buyers and knock the big crypto down to the levels mentioned.
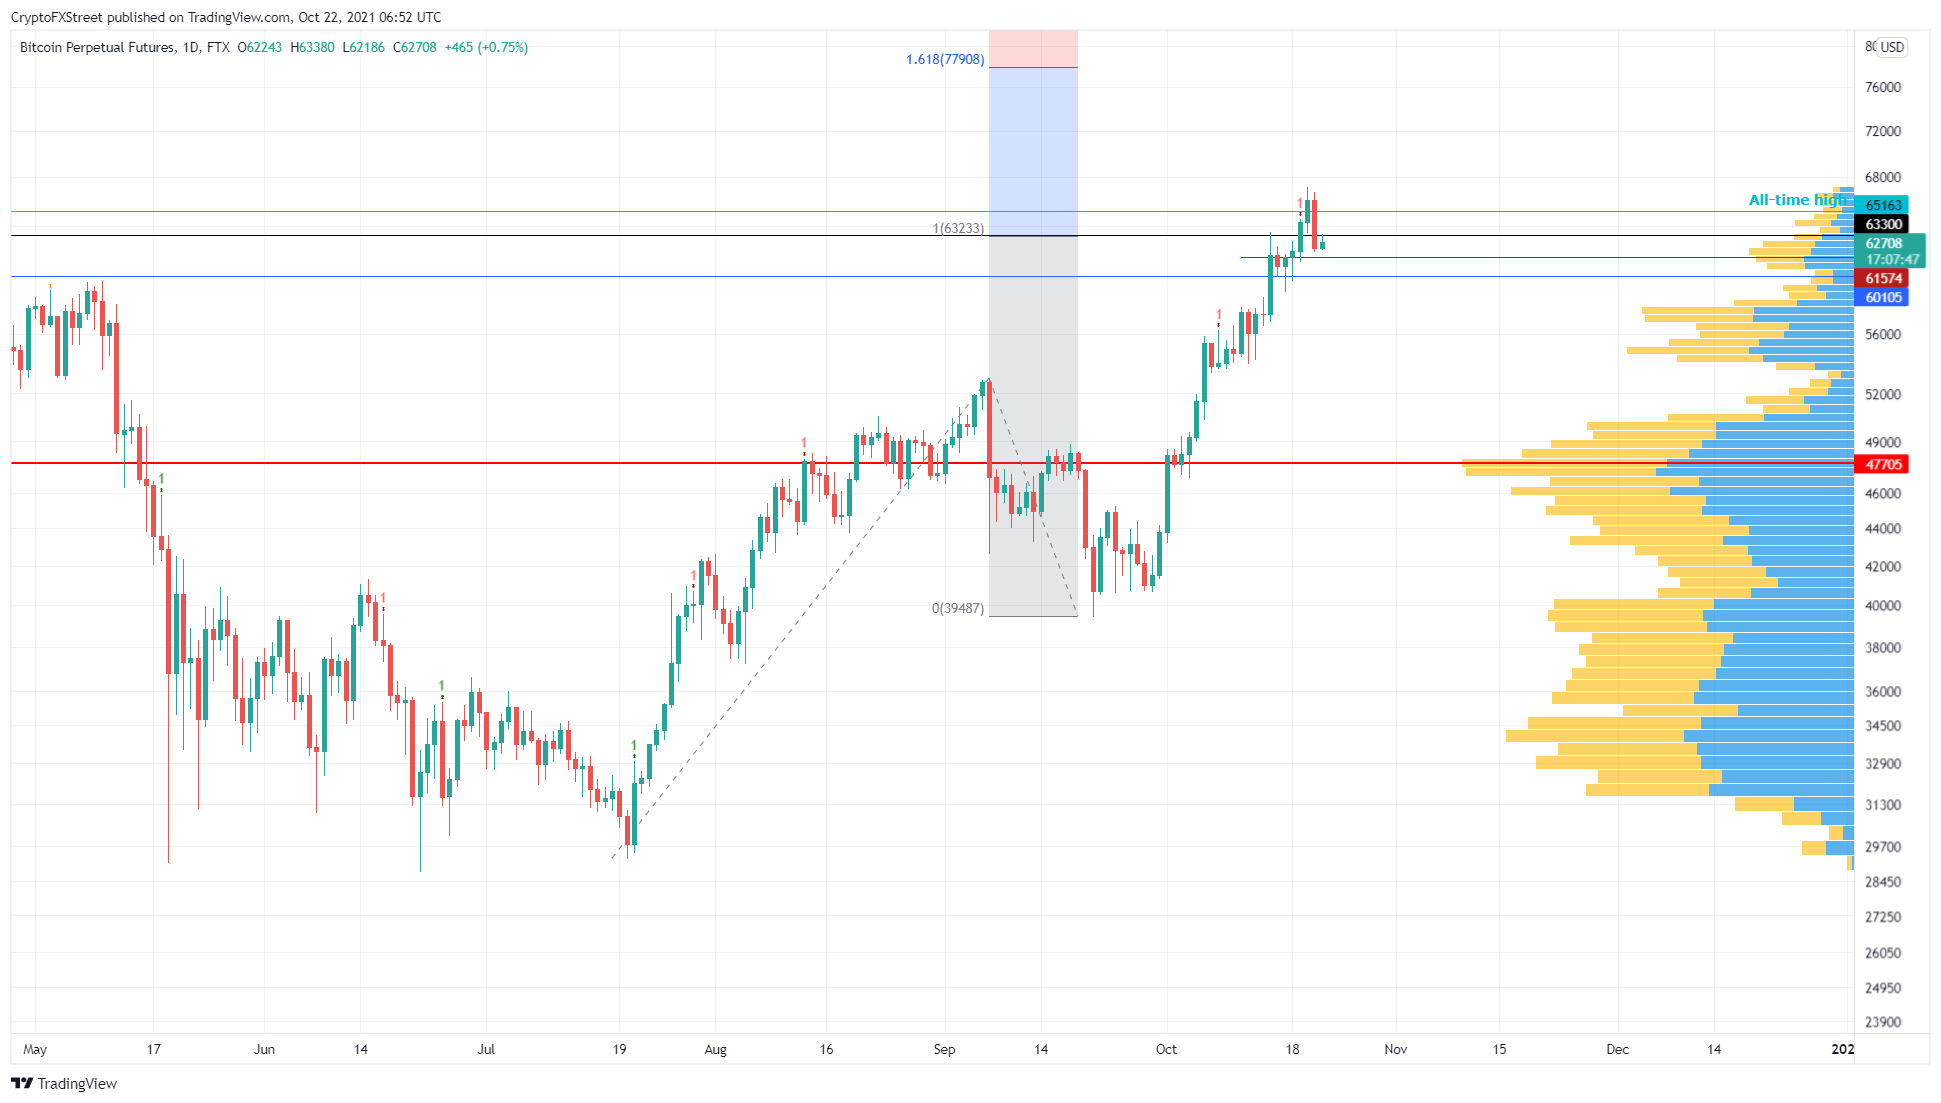
BTC/USDT 1-day chart
Adding credence to this drop is the 30-day Market Value to Realized Value (MVRV) model, which shows nearly 20% of the investors that purchased Bitcoin over the past month are in profit. This on-chain metric is used to determine the average profit/loss of holders that purchased BTC.
For a 30-day MVRV, anything above 10% is something to be concerned about, given it is at 18%, market participants can expect Bitcoin price to correct if these investors decide to book profits.
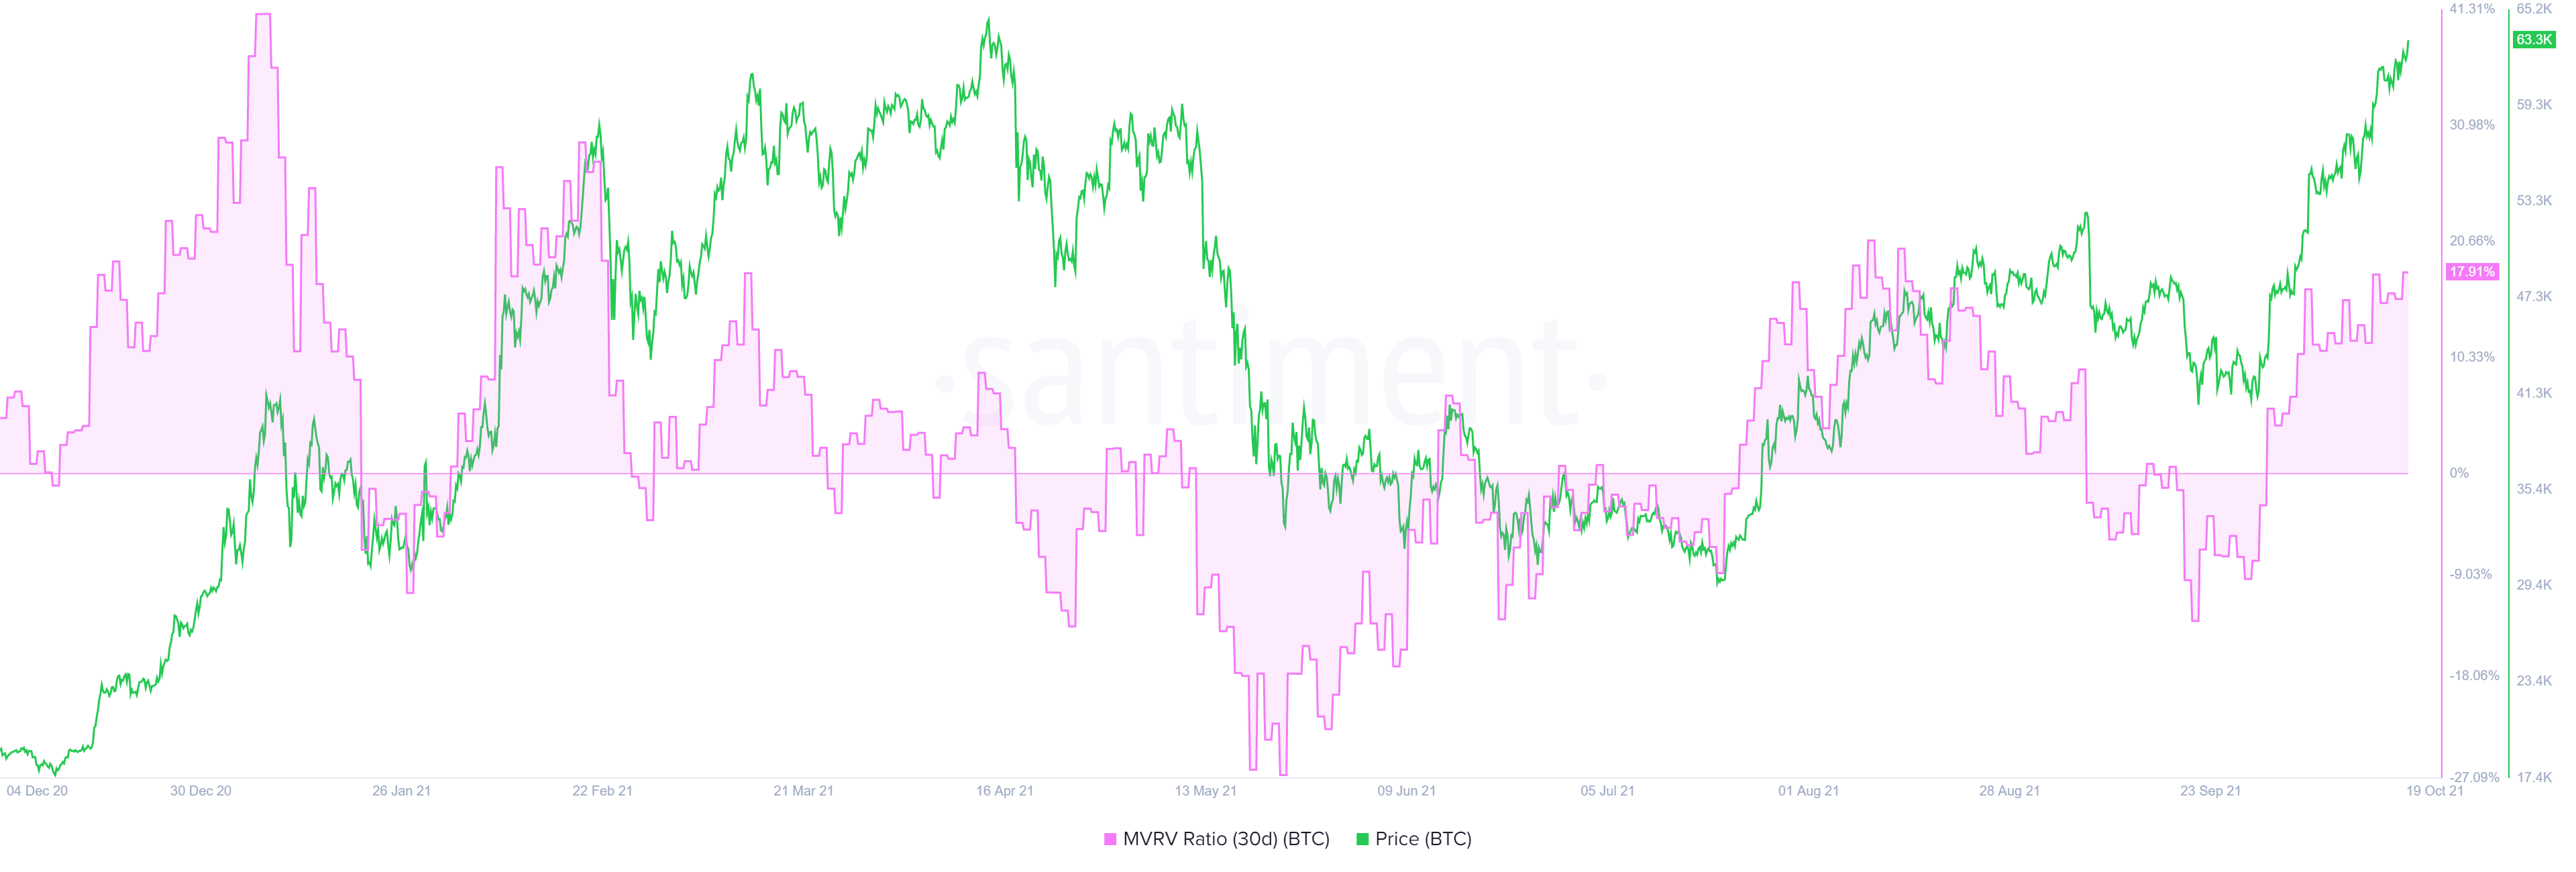
BTC 30-day MVRV chart
The number of daily active addresses and Bitcoin price are forking, leading to a bearish divergence. When the price of an asset produces a higher high and the DAA drops, it is usually observed as a decline in user interest and, therefore, an increase in the capital outflow.
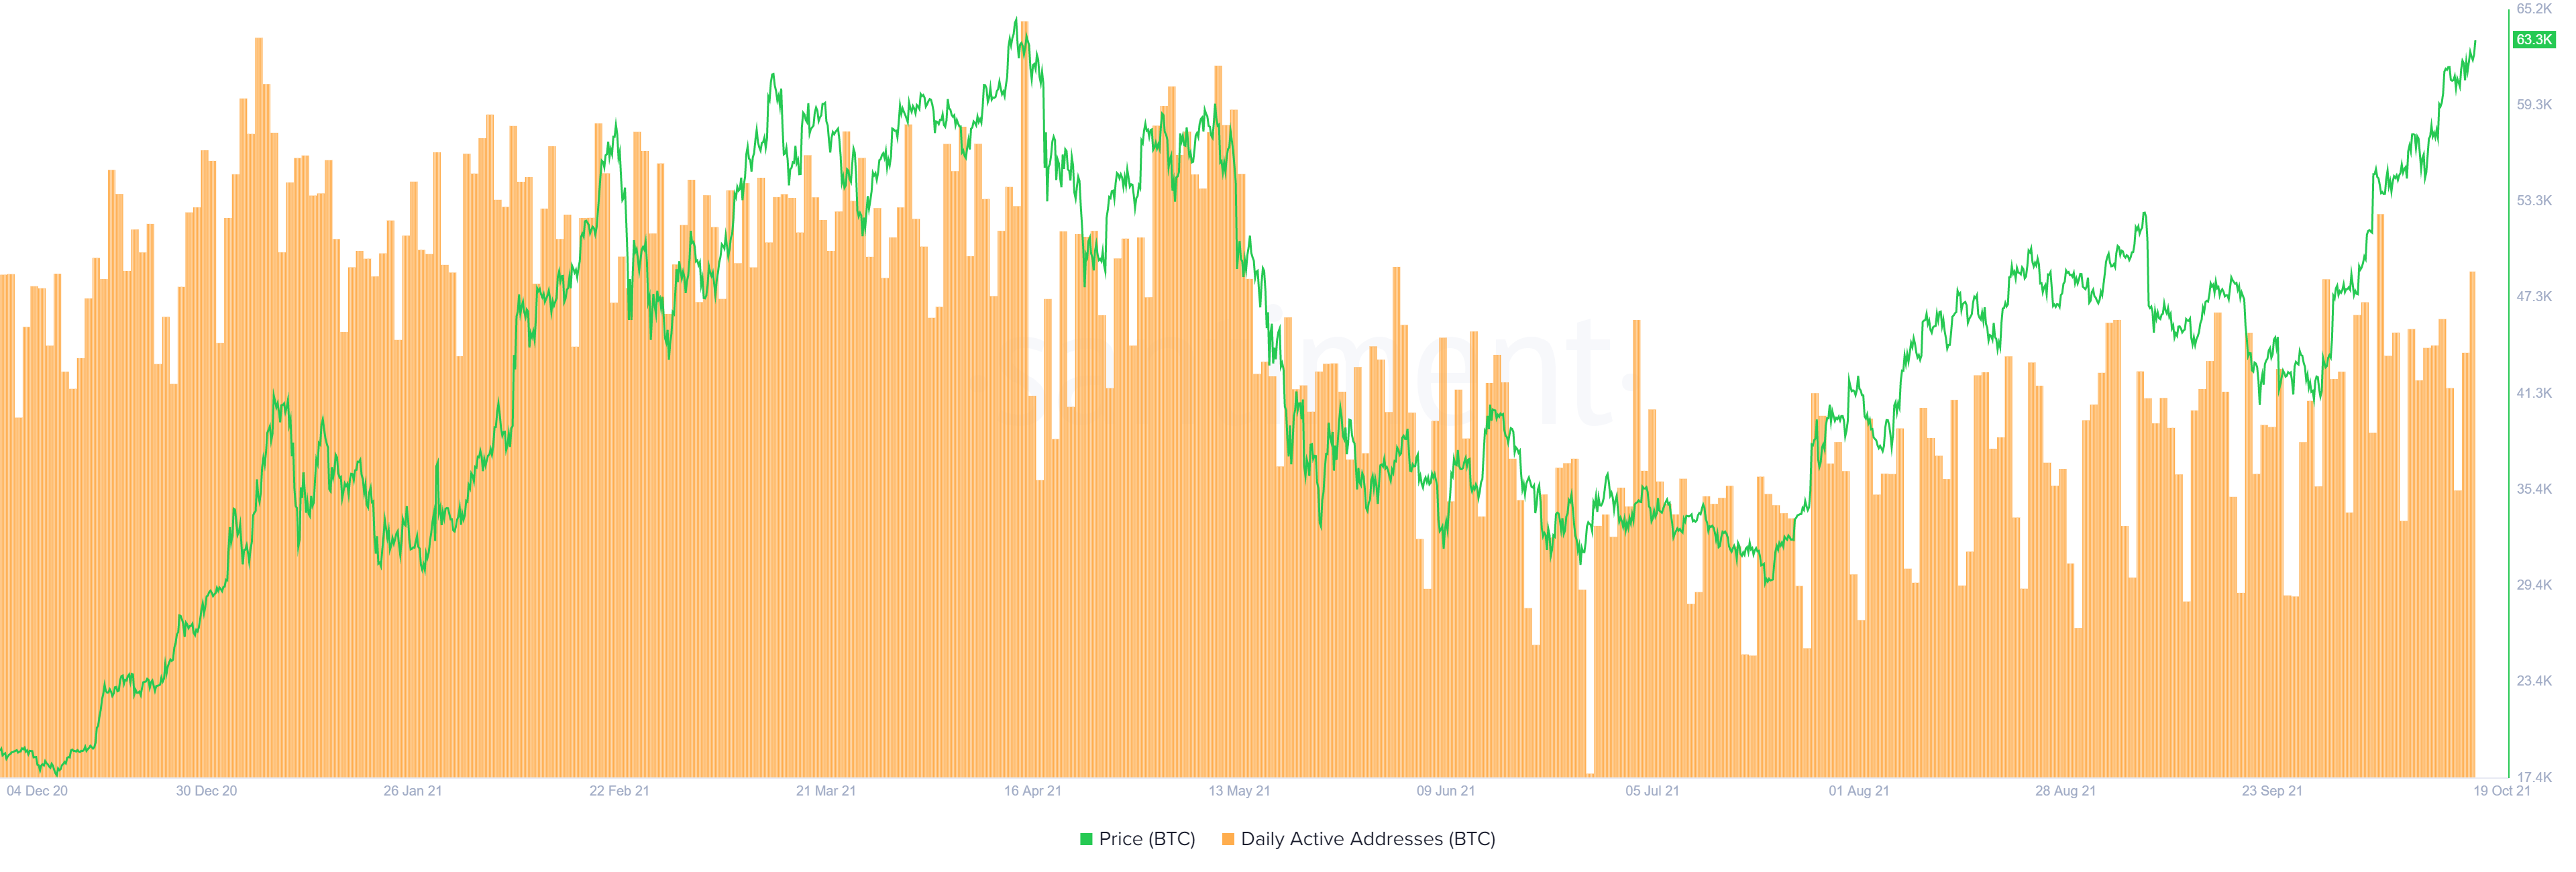
BTC DAA chart
Lastly, the funding rate of Bitcoin has reached 0.03% on some exchanges and 0.17% on ByBt, indicating that investors are greedy and are coiling up their accounts for gains. All of these indications lead to a conclusion that a short-term correction is likely.
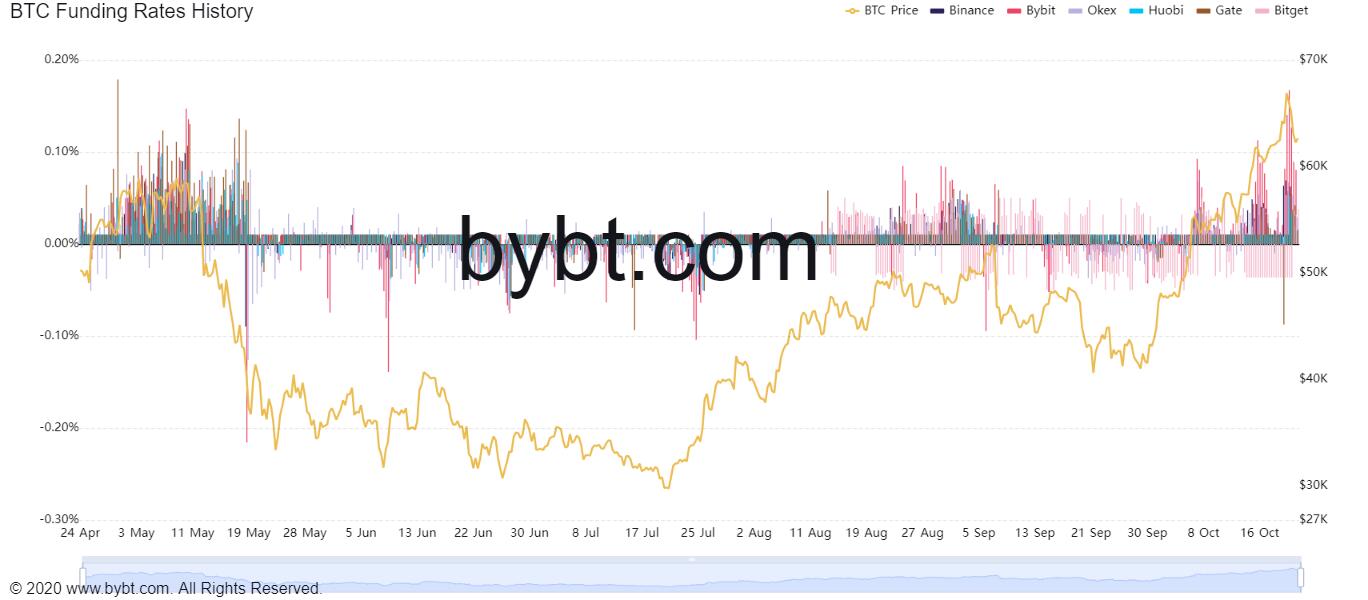
BTC funding rate chart
While things are going well for Bitcoin from a long-term perspective, the technicals and even on-chain metrics suggest that the short-term outlook is slightly bearish, with a drop to $55,000 or $53,000 potentially on the cards.
Regardless of the bearish outlook from the lower time frames, a daily close above $66,000 will result in the resumption of the uptrend. In this case, Bitcoin price will head to the 161.8% Trend-based Fibonacci extension level at $77,908, a new all-time high.


