
- Bitcoin price forecasts drop to $20,000 due to a fractal formation.
- Investors can obtain a confirmation of this crash if BTC breaches the $30,000 psychological level on a weekly time chart.
- Invalidation of the bearish outlook could occur if BTC produces a higher high above $52,000.
Bitcoin price is back to trading at its favorite psychological level and a level that it has traded at for the last month. From a macro perspective, intraday volatility does not matter, since the chances of a massive sell-off that pushes BTC to 2017 levels are high.
How will BTC react to its first recession?
While technicals only paint a part of the picture of why such a crash is inevitable, looking at the current state of the financial markets provides the other half. In a recent report, Ecoinometrics pointed out that the interest rate in the US has reached a 40-year high and that the Federal Reserve is likely to respond by cutting interest rates.
Interestingly, the last few times this happened, massive recessions followed. Some examples include the DOTCOM bubble between 1999 and 2000, the Global Financial Crisis of 2008 and most recently the COVID crash in 2020.
In all of these cases, the price of risk-on assets like the stock market has suffered brutal sell-offs. Only after the recession ended did these risky assets start recovering. Gold, on the other hand, which is considered a store of value saw a relatively minor sell-off and even quicker recovery.
Lately, Bitcoin has been highly correlated with the stock market and shows no signs of decoupling anytime soon. This intense correlation seems to have started after the COVID crash and persists even today. If this connection continues, there is a high chance BTC will also undergo the same fate as the risky assets or the stock market suffered during the previous recessions.
While inevitable, this outlook indicates that during a time of crisis, the Bitcoin price is likely to undergo a massive sell-off.
Bitcoin price prepares for brutal sell-off
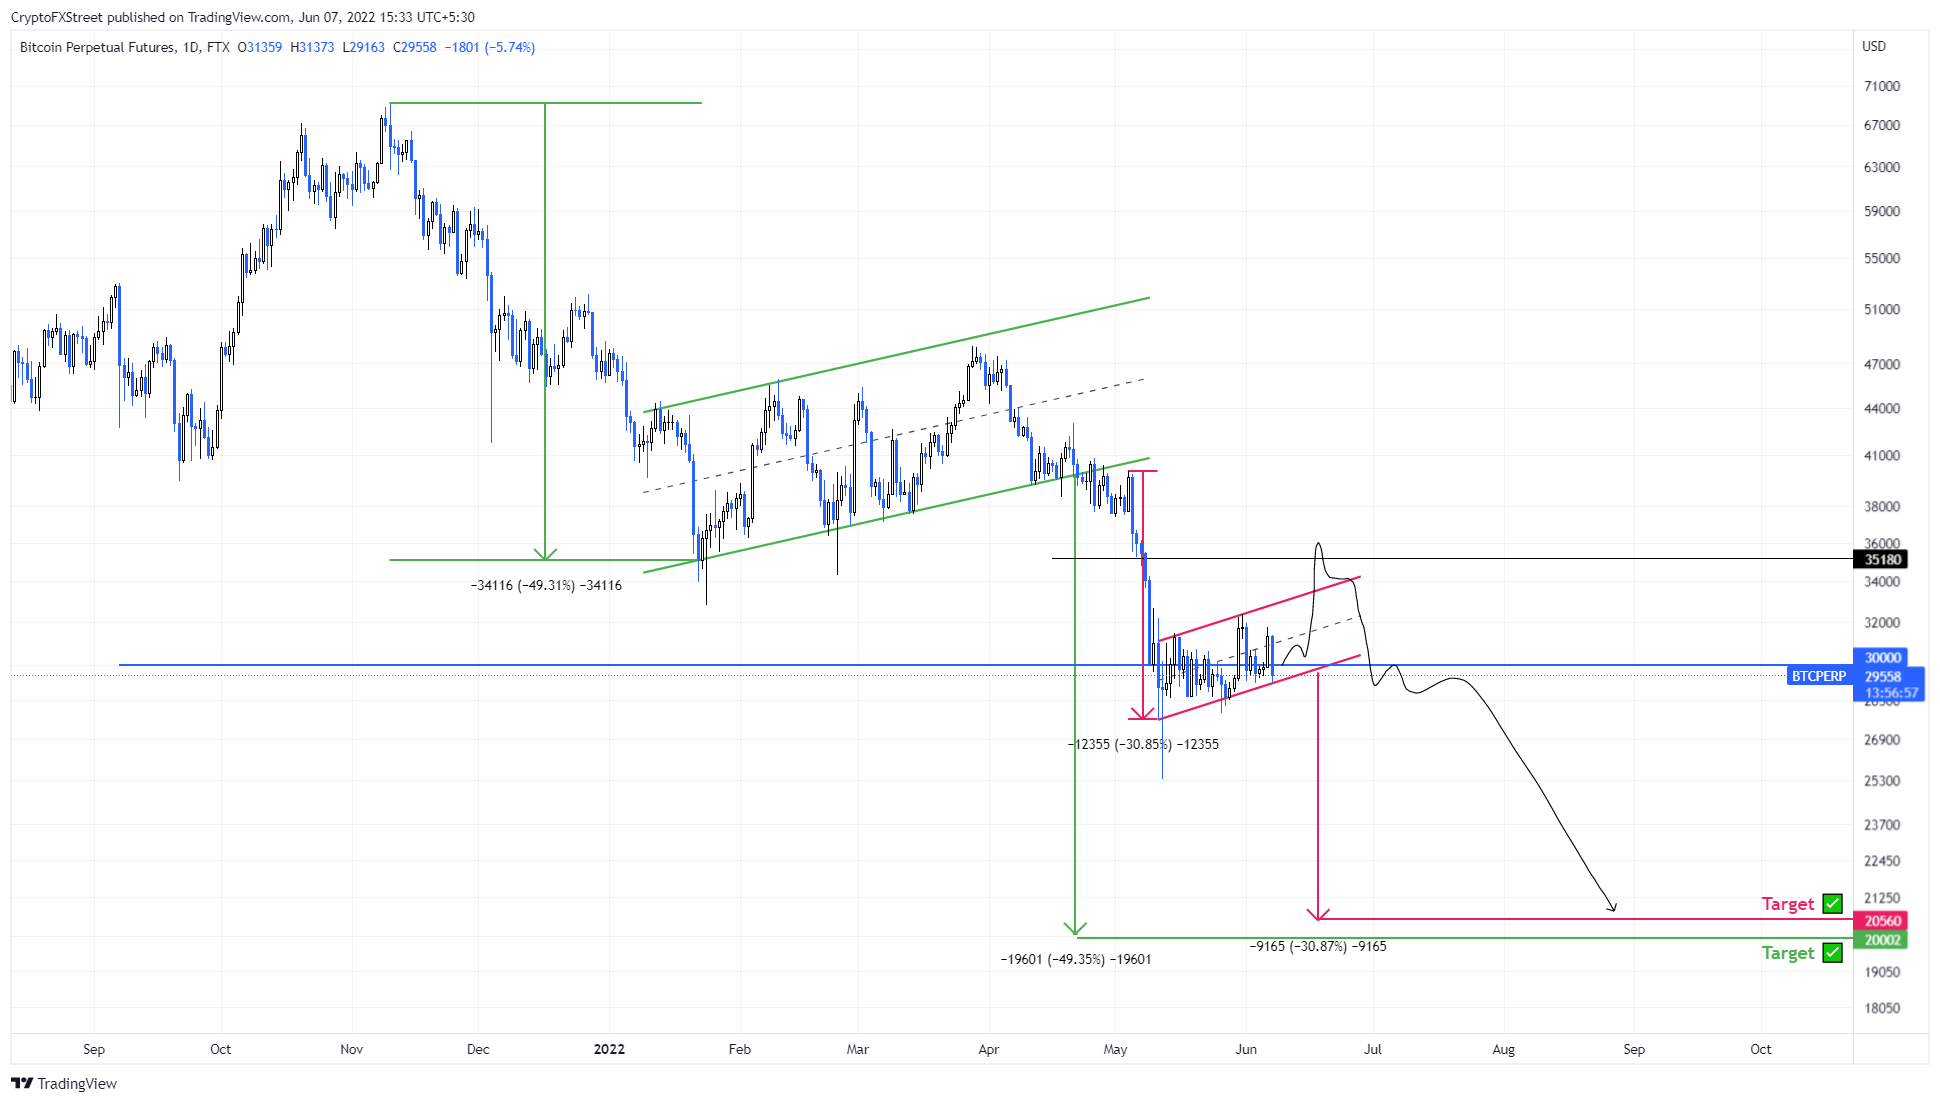
Bitcoin price is showing a bear flag setup within an already ongoing bear flag on the daily chart. As discussed in the previous article, the larger technical formation triggered a bearish breakout on May 6 and has been crashing since.
In total, this move has led to a 36% loss in a week. However, looking at the big picture shows that the plummet from Bitcoin’s all-time high of $69,000 to $32,837 between November 10, 2021, and January 24, 2022, created the pattern’s flagpole.
The consolidation that followed after this sell-off is the flag and is present in the form of higher lows and higher highs between January 14 and May 22. This ascending parallel channel-like structure is known as a flag.
Flags are continuation patterns, and for this one the forecast is for price to fall to a target of roughly $20,000. This is obtained by adding the flagpole’s height to the breakout point at $38,305, which as mentioned above, was breached on May 6.
Interestingly, the downtrend from the larger bear flag has produced a smaller one during the consolidation. This technical setup, however, forecasts a 30% drop to $20,000, revealing a confluence and adding credence to the bigger pattern.
BTC/USDT 1-day chart
While things are looking awfully bearish for Bitcoin price, a daily or weekly candlestick close above $52,000 will invalidate the bearish thesis from a macro perspective by producing a higher high. In this situation, Bitcoin price could extend higher and retest the $60,000 psychological level.


