
- Cardano price closed last week with a 6.89% gain after failing to hold gains above the 2018 high of $1.40.
- ADA has shaped a head-and-shoulders pattern with a measured move of approximately 60%.
- IOMAP metric indicates that the digital token faces limited resistance (out of the money addresses) to claiming the 2018 high.
Cardano price staged a rebound in July after dropping near the 38.2% Fibonacci retracement at $0.971, marking the fifth consecutive month of a bullish reversal from the level. Despite another bullish reversal, the ADA outlook remains mixed with the 2018 high still inflicting heavy resistance on breakout attempts. Only a daily close above $1.498 would transition the outlook to moderately positive.
Cardano price cannot discover follow-through
Cardano price has climbed 30.25% since July 21 after the daily Relative Strength Index (RSI) registered an oversold reading for the first time since September 2020. The 30.25% gain is on the lower end of the performance spectrum for altcoins, but it has positioned ADA again at the 2018 high of $1.40. Moreover, it ensured the fifth consecutive month of support around the 61.8% retracement level.
Also, note in the monthly chart below that Cardano price has failed to record a monthly close above the 2018 high on five of the past six months, despite trading above at some point. Further technical evidence of the roadblock that confronts ADA.
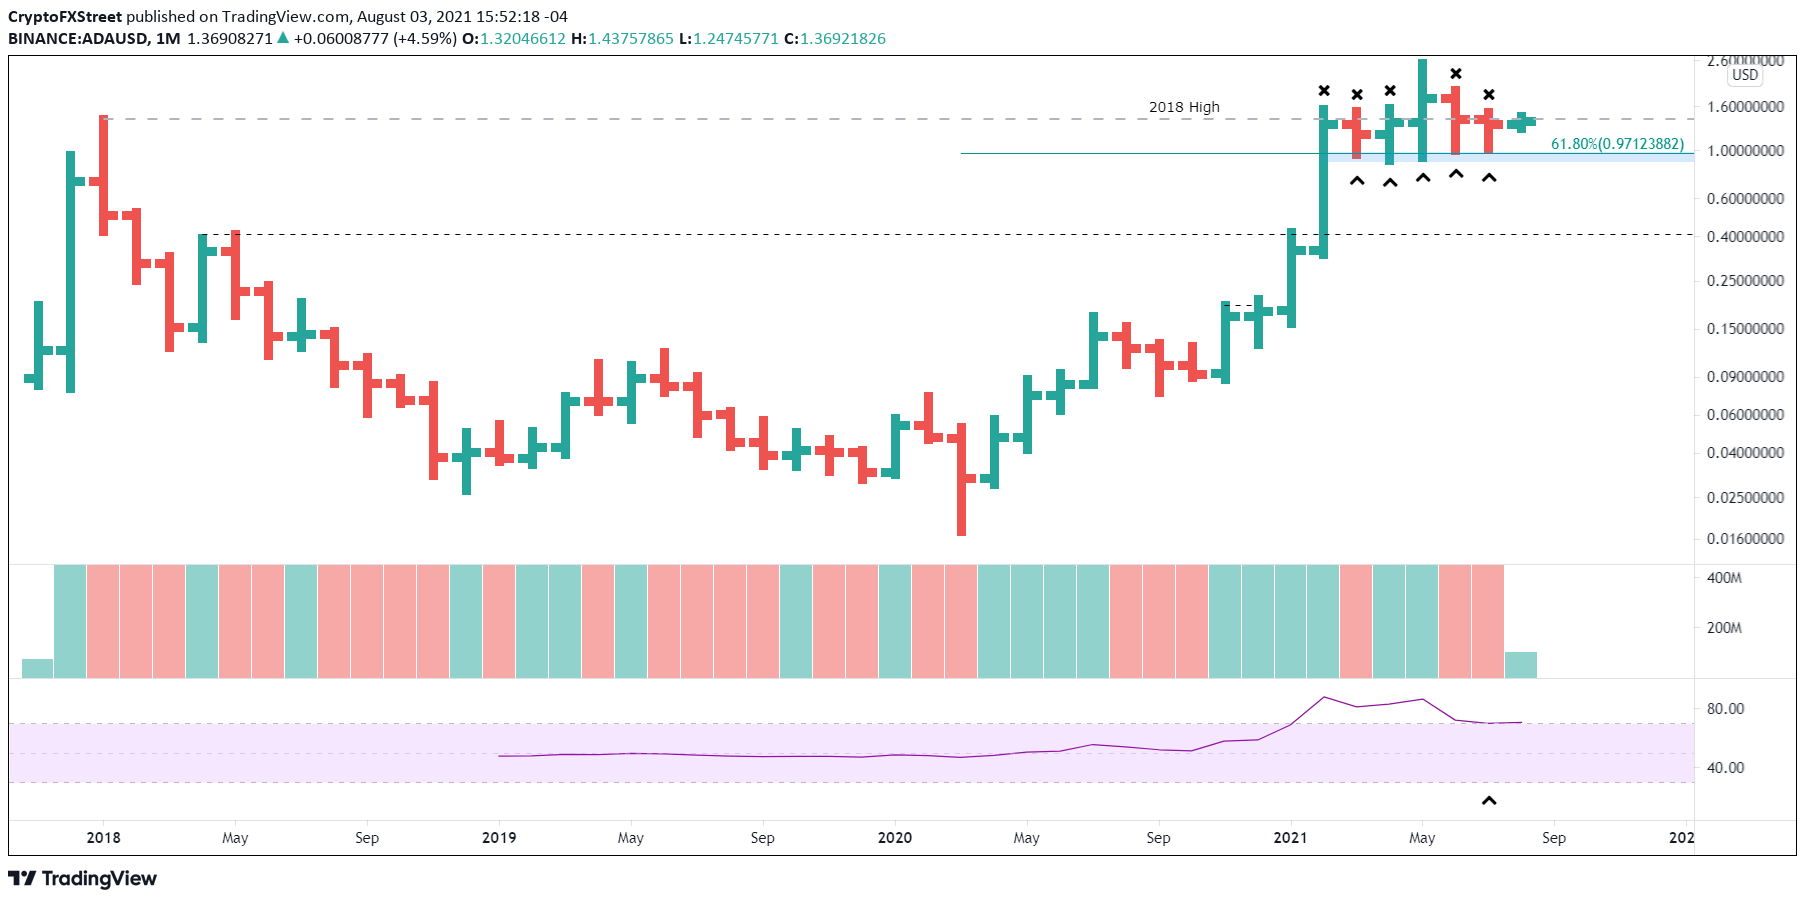
ADA/USD monthly chart
The rebound has clarified the Cardano price structure, introducing a head-and-shoulders pattern with a measured move of just over 60% and a price target of $0.375 based on the 61.8% retracement level of the advance from the March 2020 low as the neckline. A drop of that magnitude would undermine support at the 50-week simple moving average (SMA) at $0.784 and press ADA below the April 2018 high of $0.410.
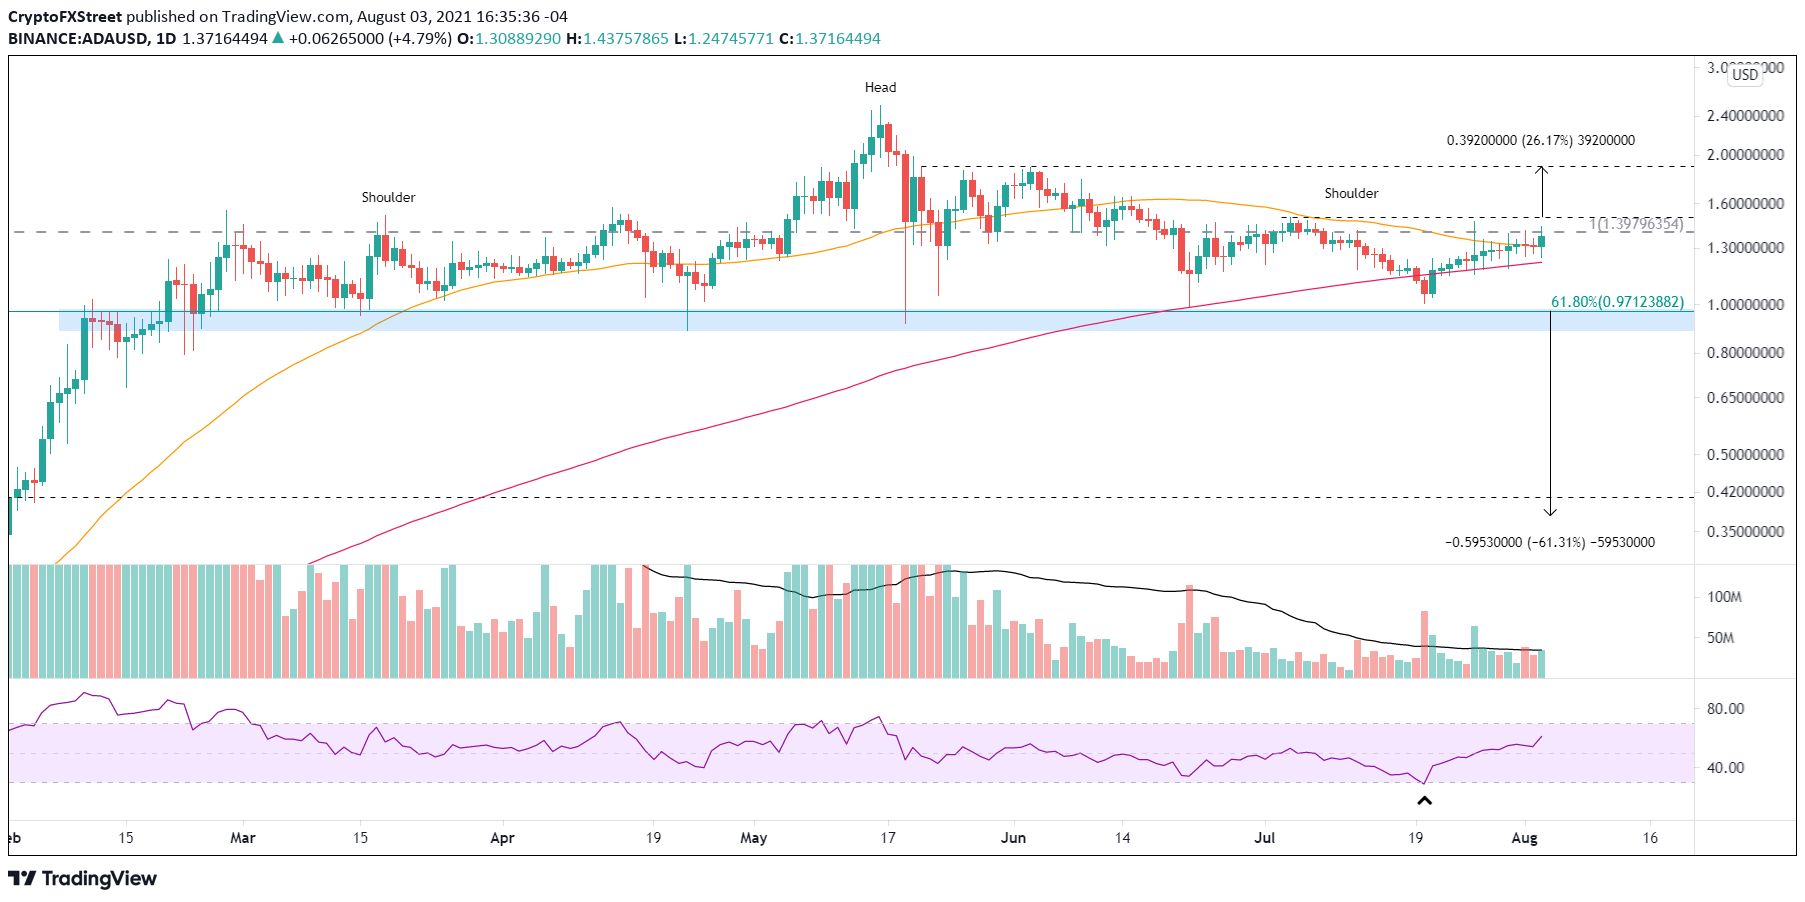
ADA/USD daily chart
A positive outlook would emerge with a daily close above the July 4 high of $1.49. As a result, Cardano price would be exposed to the potential for an ADA rally to the first notable layer of resistance around $1.89, which yields a 26% gain from the July 4 high.
Even so, the question remains whether Cardano price can hold the gains into the month's close, thereby forcing a conservative trading posture.
With the 2018 high serving as the enemy of Cardano price, it is interesting to note that the IntoTheBlock In/Out of the Money Around Price (IOMAP) metric reveals minor resistance to $1.58. The cluster between $1.38 to $1.42 shows just 51.8k addresses (out of the money) holding 510.66 million ADA at an average price of $1.40. It is not the type of weight that the charts seem to indicate.
There is a slight bump up in out of the money addresses between $1.42 and $1.46, but again, it is minor compared to the heavy support (in the money addresses) from $1.37 to $1.17.
Overall, the IOMAP suggests that Cardano price is poised to tackle the 2018 high and the July 4 high of $1.498 with relative ease.
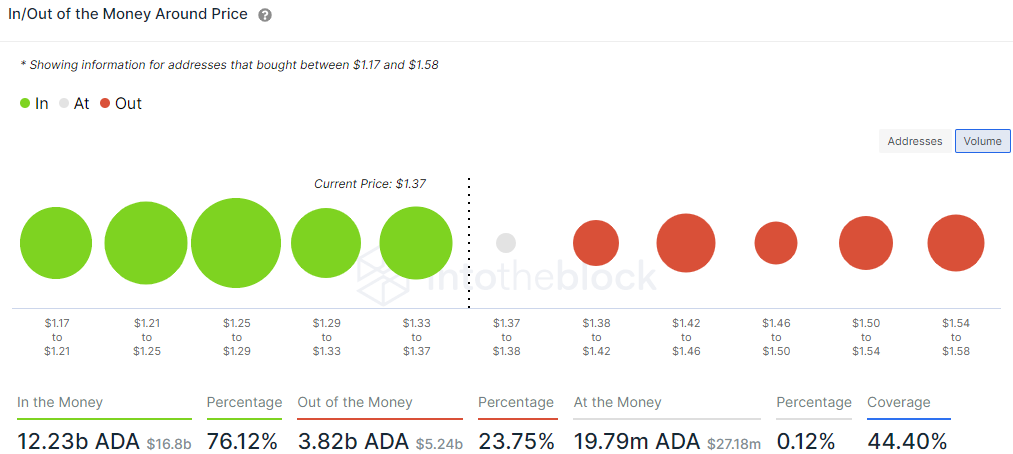
ADA IOMAP – IntoTheBlock
The on-chain metric IOMAP marks a bullish departure from the bearish technicals displayed on various timeframes. Nevertheless, until Cardano price can show follow-through and log a close above the July 4 high, the short-term outlook remains neutral-to-bearish as the head-and-shoulders pattern carries serious bearish implications for ADA.


