
- Cardano price records a significant reversal at the 2018 high, reminding investors of February, March, and April struggles.
- 50-day simple moving average (SMA) becoming influential again, restricting upside price traction.
- ADA symmetrical triangle's upper trend line is a good source of support for any weakness.
Cardano price was firmly rejected at the 2018 high on July 26, emphasizing the importance of the level in securing a renewed and sustainable rally to the all-time high. Unless $1.40 can be broken on a daily closing basis, ADA is far from bullish outcomes.
Cardano price breakout carries no spirit, questioning the viability
On July 26, Cardano price resolved the long-standing symmetrical triangle with a daily close above the upper trend line. It was the culmination of the brief rally that began on July 21 after ADA fooled investors with a bear trap.
Since the breakout, Cardano price has struggled with the 50-day SMA, similar to the failed ADA attempts in mid-June that resulted in a new wave of selling, ending with the June 22 low at $0.98.
The measured move of the symmetrical triangle pattern is close to 63%, signaling a Cardano price target of $2.01, putting ADA less than 30% away from the all-time high of $2.51 printed on May 16.
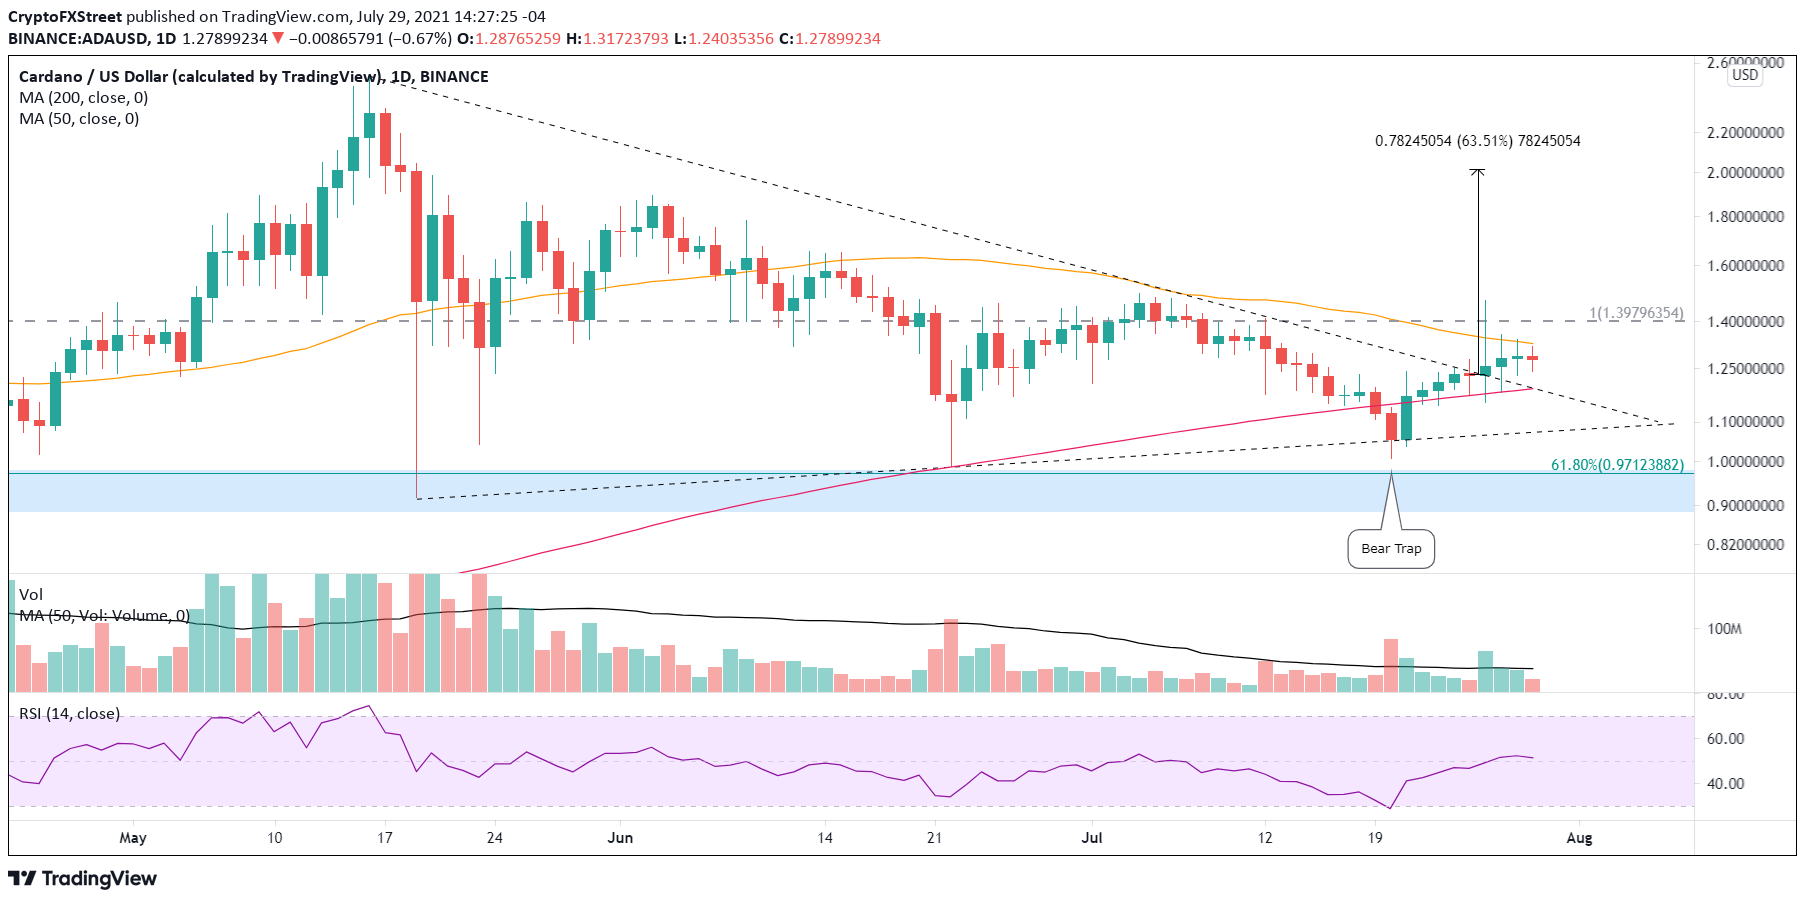
ADA/USD daily chart
From an intraday perspective, Cardano price could be shaping a cup-with-handle pattern that may provide the foundation for a sustainable advance and a successful test of the symmetrical triangle’s measured move target of $2.01.
The measured move of the cup-with-handle base is just over 37%, generating an ADA price target of $1.93, very close to the symmetrical triangle price target. Adding to the symmetry of the price structure is that the high of the handle is $1.40, further emphasizing how important the 2018 high is to bullish outcomes for Cardano price.
Thus, if Cardano price can sustain an advance above $1.40, ADA should be primed to target the range of $1.93-$2.01.
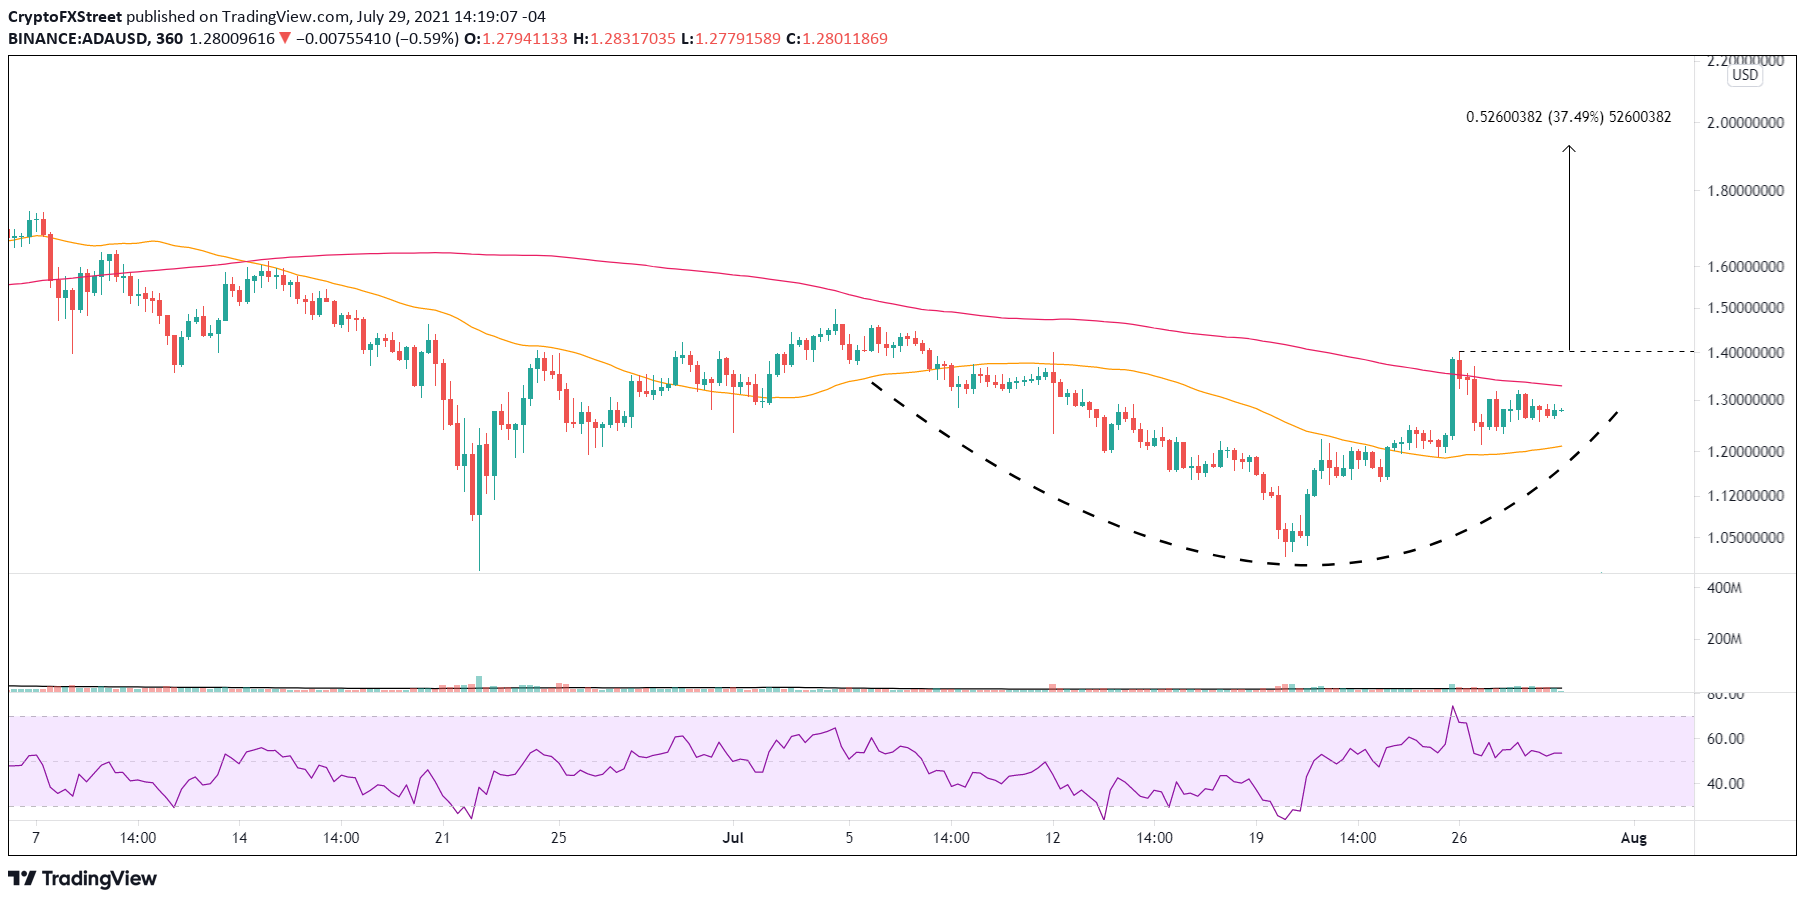
ADA/USD 6-hour chart
On the downside, Cardano price is supported by the confluence of the 200-day SMA at $1.19 with the symmetrical triangle’s upper trend line. Any weakness below the moving average will encourage a test of the triangle’s lower trend line at $1.07. If there is a collective sell-off in the cryptocurrency complex, ADA may reach the 61.8% retracement of the rally from March 2020 at $0.97.
Based on the price action over the 4-5 days, the Cardano price breakout from the symmetrical triangle does not look viable, but a close above $1.40 would change that statement, triggering the cup-with-handle pattern and swiftly pushing ADA to the $1.93-$2.01 range.
Here, FXStreet's analysts evaluate where ADA could be heading next as it seems bound to breakout.


