
- Cardano price could provide a buy opportunity at lower support levels before the bulls try to reverse the period of sluggish performance.
- A key technical indicator suggests that there are more sellers than buyers in the market.
- If ADA slices above $1.39, a 40% climb will be on the radar.
Cardano price could tag lower levels before ADA bulls prepare to reverse the period of underperformance. The Ethereum killer could slide toward the January 10 low at $1.07 before falling toward the lower boundary of the prevailing chart pattern at $1.04.
Cardano price weakens as bearish momentum increases
Cardano price is forming a falling wedge pattern on the daily chart, as ADA continues to create lower lows and lower highs. The Arms Index (TRIN) indicates that there are currently more sellers than buyers in the market, suggesting that the token could fall lower to test crucial levels of support before a recovery is in the offing.
The first line of defense for Cardano price is at the December 4 low at $1.18. ADA may discover another foothold at the June 23 low at $1.10 before the token falls toward the January 10 low at $1.07.
Additional selling pressure may push Cardano price lower to tag the lower boundary of the governing technical pattern at $1.04.
However, if a spike in buy orders occurs, Cardano price may aim higher to tag the 61.8% Fibonacci retracement level, coinciding with the August 3 low at $1.26. ADA will face further resistance at the 21-day Simple Moving Average (SMA) at $1.30, then at the 50% retracement level at $1.33.
Additional obstacles may emerge at the 50-day SMA at $1.35 before Cardano price tags the upper boundary of the prevailing chart pattern at $1.39, coinciding with the 38.2% Fibonacci retracement level.
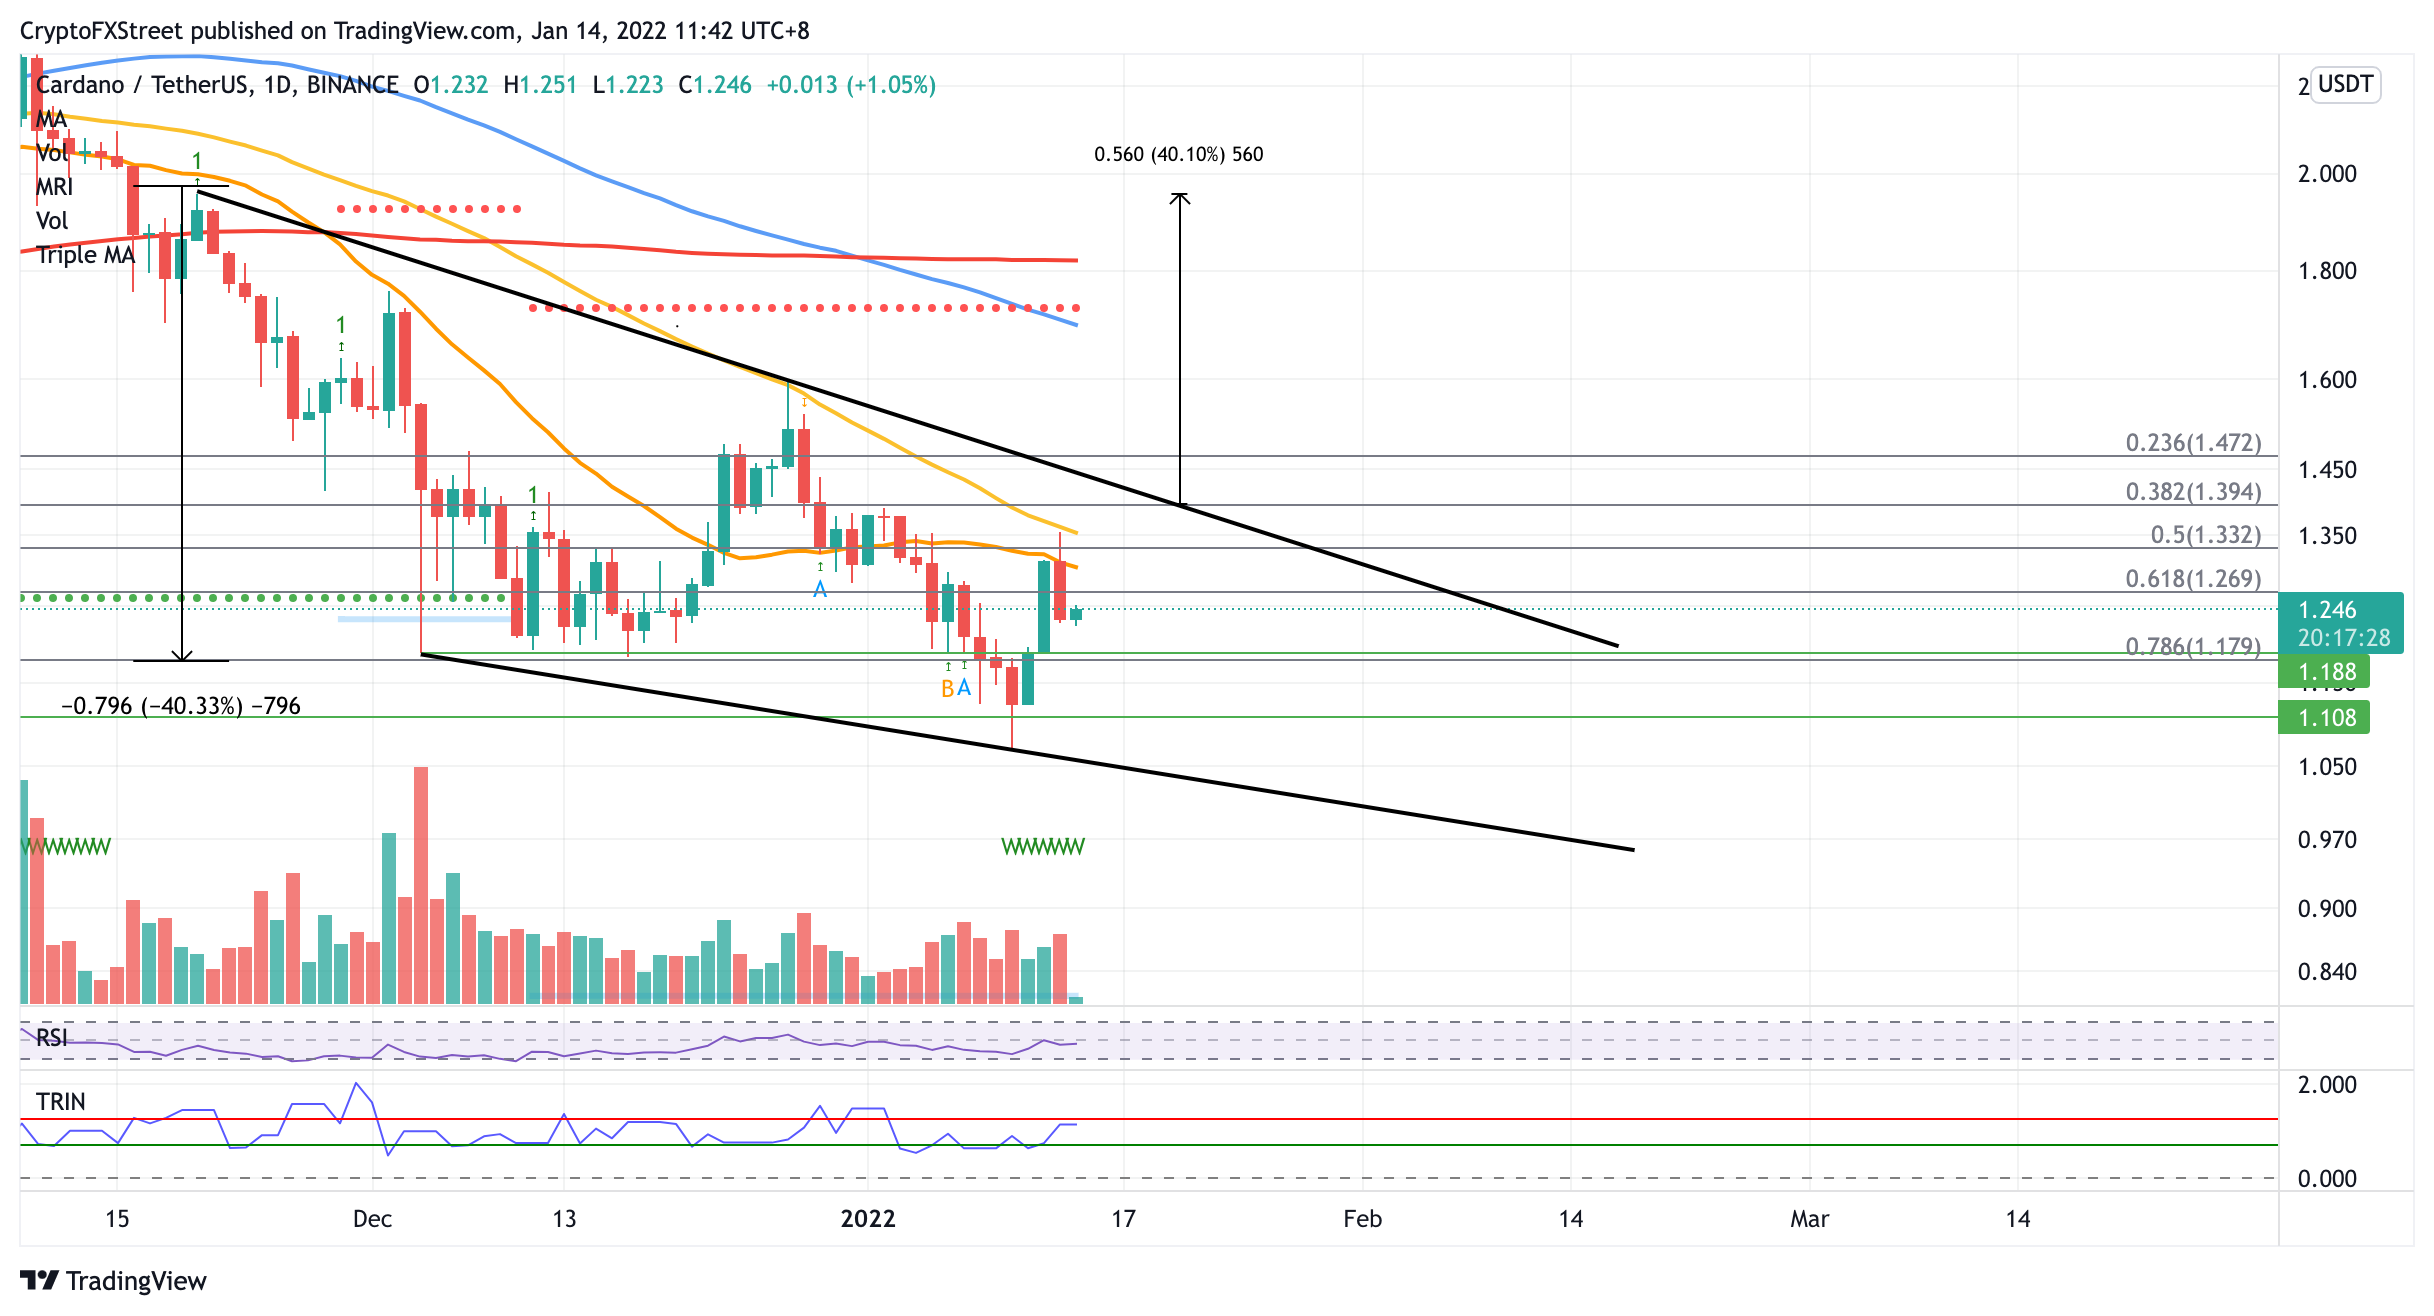
ADA/USDT daily chart
Investors should note that a slice above the aforementioned line of resistance may put a 40% climb toward $1.95 on the radar, a bullish target given by the governing technical pattern.
However, before the optimistic target could be reached, ADA must also break above the 23.6% Fibonacci retracement level at $1.47, the 100-day SMA at $1.69 and the 200-day SMA at $1.81.


