
- Chainlink price is dangerously hovering within a rising channel while losses to $5.80 linger.
- Enterprise-grade middleware from Chainlink can help organizations develop climate markets and enhance energy management.
- LINK price may hold support at the 100-day SMA and buyer congestion at $7.00, as highlighted by the IOMAP.
Chainlink price is still dealing with selling pressure extended from earlier in the week when it got rejected from resistance around $8.00. The smart contracts' price feed oracle token slowed its downtrend at the rising channel's lower boundary – reinforced by the 100-day (blue) Simple Moving Average (SMA).
Meet Chainlink's enterprise-grade middleware
Chainlink has positioned itself as the industry standard for on-chain climate data. The network provides organizations with enterprise-grade middleware – supporting high integrity, interoperable, and efficient climate markets.
Chainlink aims to advance climate markets and foster energy management and sustainable initiatives. Users can tap Chainlink resources to bring Web2 data on-chain, supporting smart Web3 solutions. Enabling highly efficient climate ecosystems requires targeted digital measurements, reporting and verification.
Chainlink is one of the most utilized crypto projects in the industry. Most smart contracts and decentralized finance (DeFI) platforms operate using data processed by Chainlink's oracle protocol.
#Chainlink is the industry standard for on-chain climate data
Learn how Chainlink enterprise-grade middleware can help companies and institutions build climate markets, improve energy management, and advance other sustainability initiatives. https://t.co/JiBhgJ1iFF
— Chainlink (@chainlink) September 14, 2022
As a rule of thumb for all crypto projects, utility use cases create and build value. That being so, Chainlink price is better positioned for a bullish outlook even as the crypto market wades through current murky bearish waters.
Chainlink price recovery banks on this support
The ascending parallel channel's middle boundary, in conjunction with the 100-day SMA, helped LINK price fight off bears, stopping declines from breaking out of the channel and advancing to downhill levels at $6.40 and $5.80. At the time of writing, the token teeters at $7.32, inside the channel, while bulls focus on pushing for a spike up to the upper boundary, and potentially beyond.
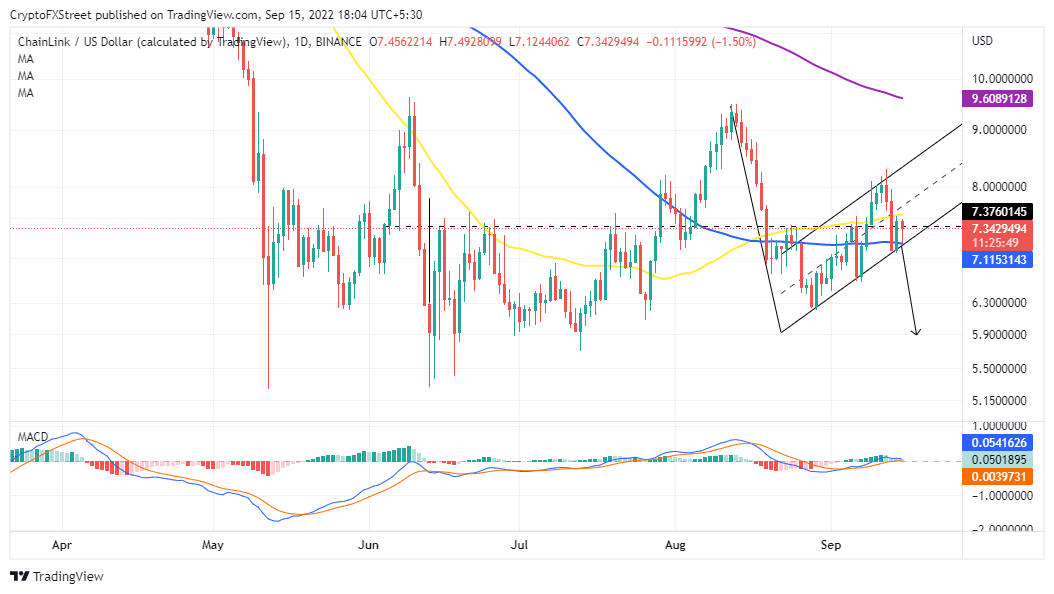
LINK/USD daily chart
Capping Chainlink's immediate upside is the 50-day SMA (yellow). However, with the Moving Average Convergence Divergence (MACD) holding above the mean line, the odds may favor the resumption of its uptrend. At the same time, a break above the seller concentration at $8.00 might be LINK price's quickest exit from stubborn bearish shackles.
-637988466287573309.png)
Chainlink IOMAP model
The In/Out of the Money (IOMAP) on-chain model from IntoTheBlock, cements the presence of LINK bulls between $6.68 and $6.93. Approximately 10,600 addresses previously purchased 296 million tokens in this range. It is unlikely that holders in this zone will easily give up their gains, considering the need to push Chainlink price higher.
In other words, bears will have to work tirelessly to crack the support area. Besides, the lack of solid resistance levels to $8.00 suggests that the path with the least resistance is to the upside.


