
- Chainlink price falls back inside the Ichimoku Cloud, giving buyers a cause for concern.
- LINK has lost more than 14% from the weekly high to move below the weekly open.
- The Weekly Ichimoku chart shows bearish conditions, but the Point and Figure chart hints at a solid upcoming rally.
Chainlink price is facing difficulties moving above a significant resistance zone on the weekly chart. Failure to close above this resistance on the weekly chart could trigger a strong resumption of falling prices.
Chainlink price has a decision to make – a return to $20 or a rally to $33
Chainlink price behavior and the overall trend for the remainder of January will likely be decided this Friday. On Chainlink’s weekly chart, the $25 level contains the 50% Fibonacci retracement, Tenkan-Sen, and Kijun-Sen. Bulls pushed LINK above the $25 level on Sunday, but the Thursday trading session saw LINK return below that critical zone.
Failure to stay above the $25 price level will likely trigger a fall to the bottom of the Cloud (Senkou Span A) at the $20 value area.
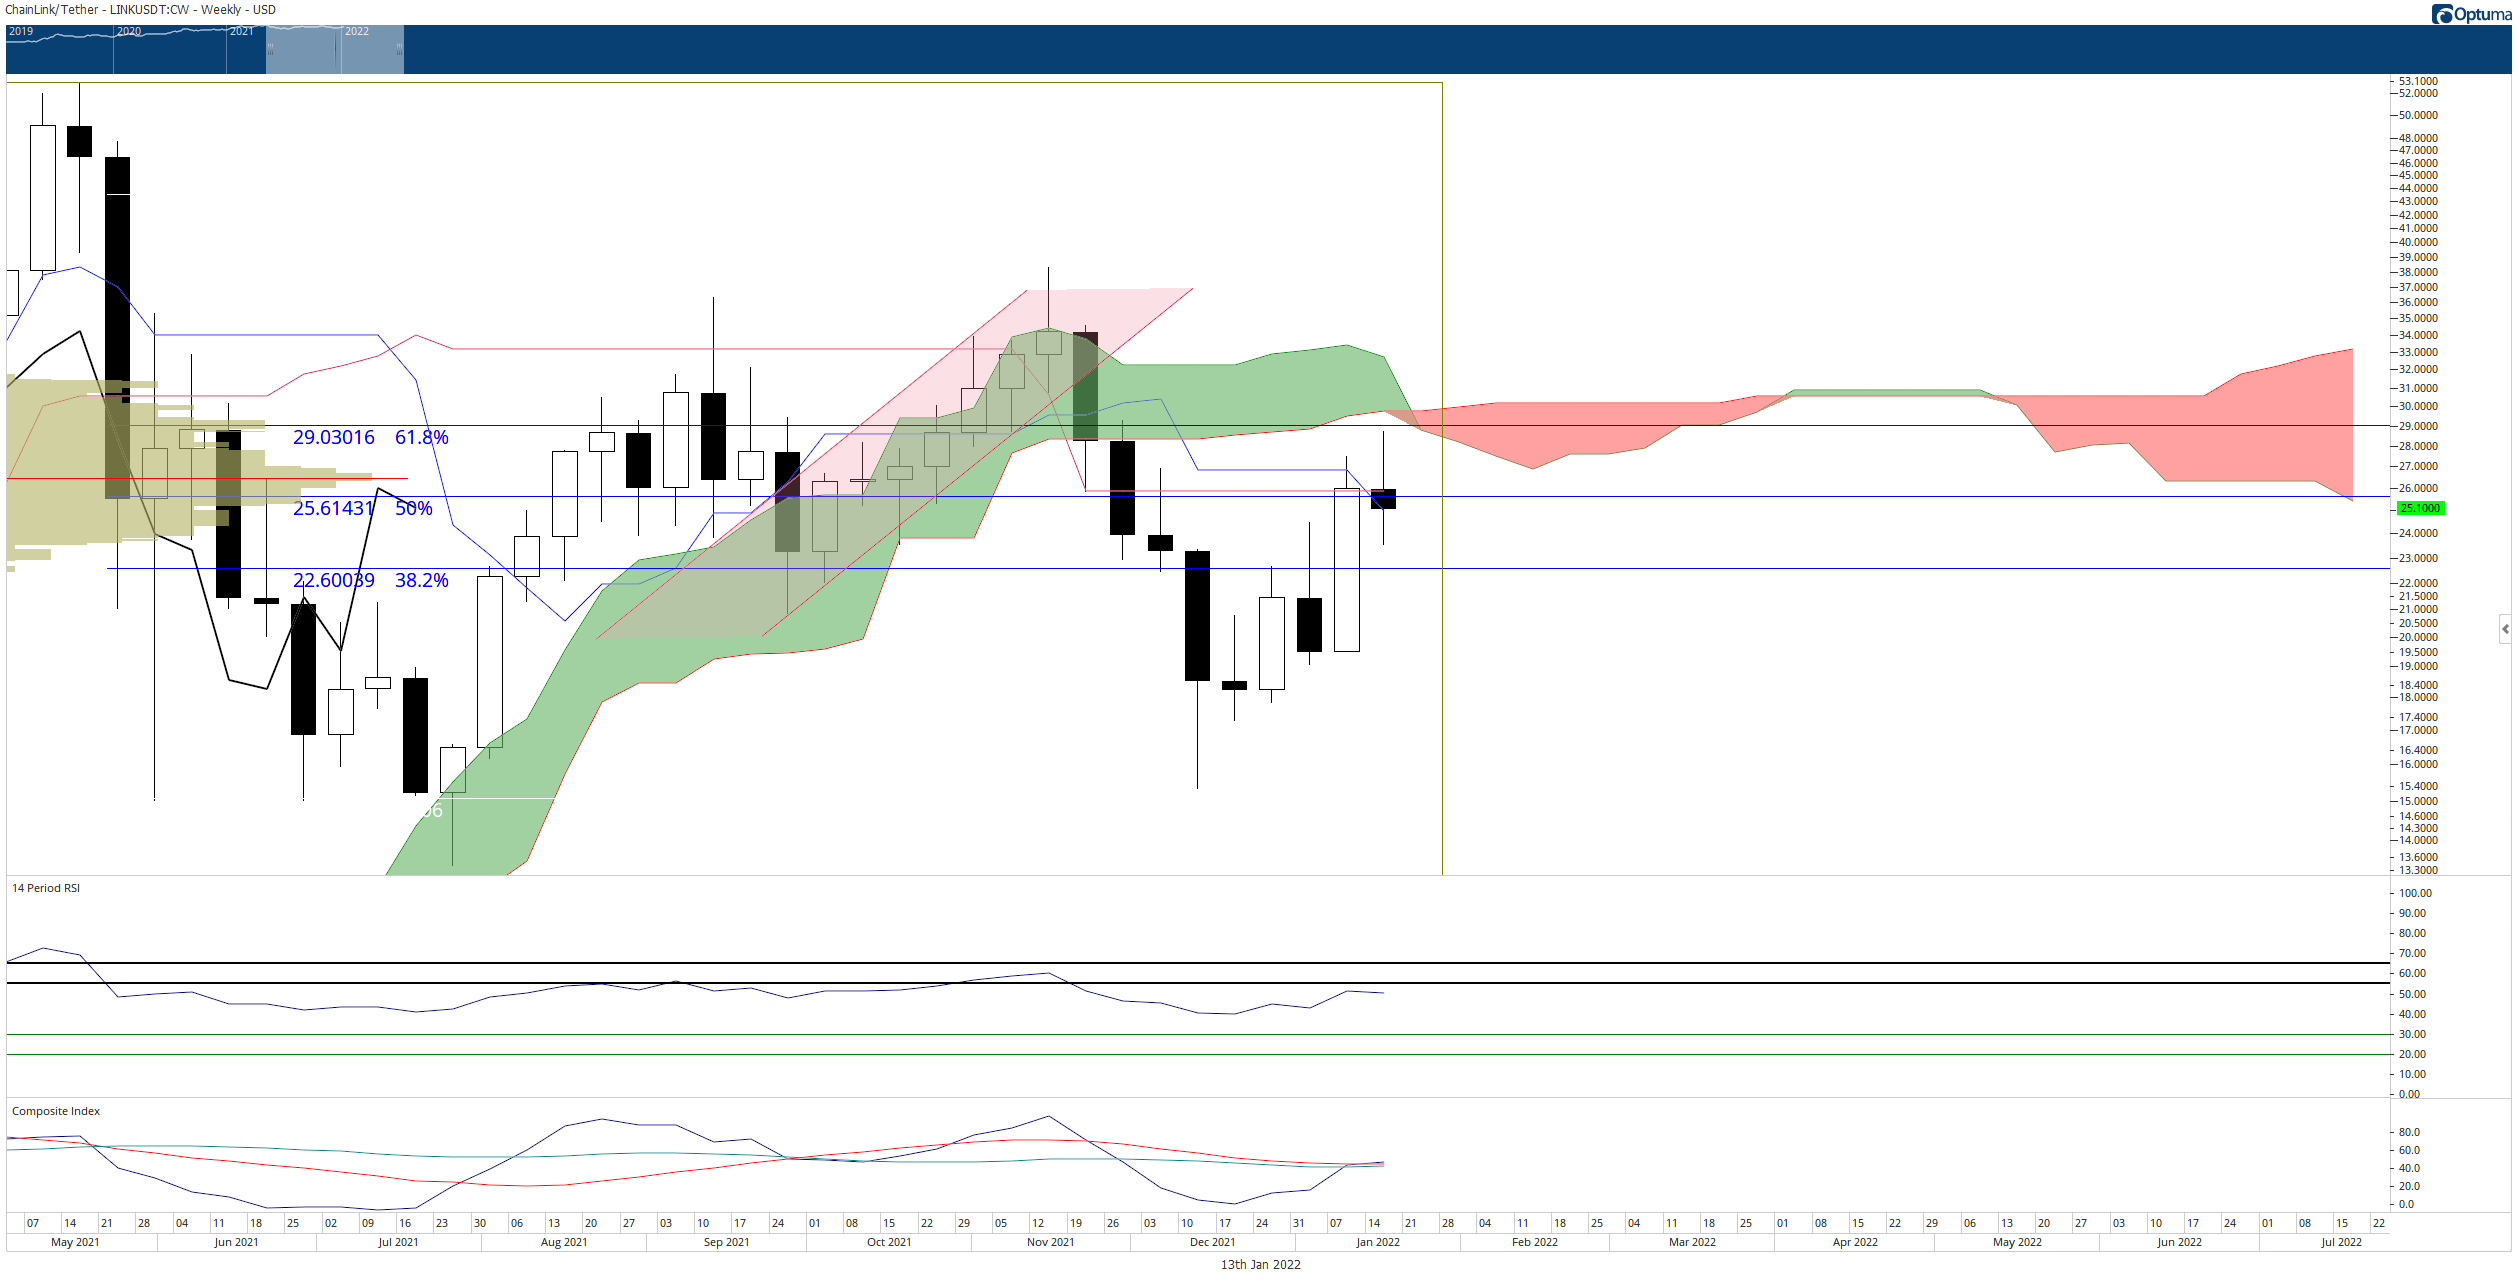
LINK/USDT Weekly Ichimoku Kinko Hyo chart
However, despite the near-term bearish price action, Chainlink price has nonetheless developed a rare and highly bullish trade setup on its $0.50/3-box reversal Point and Figure chart. That pattern is known as a bullish shakeout.
A hypothetical long setup for Chainlink price is a buy stop order at $26, a stop loss at $24.50, and a profit target at $34.50. This trade represents a 5.67:1 reward/risk with an implied profit target of 33% from the entry. A trailing stop of two or three boxes would help protect any implied profit made post entry.
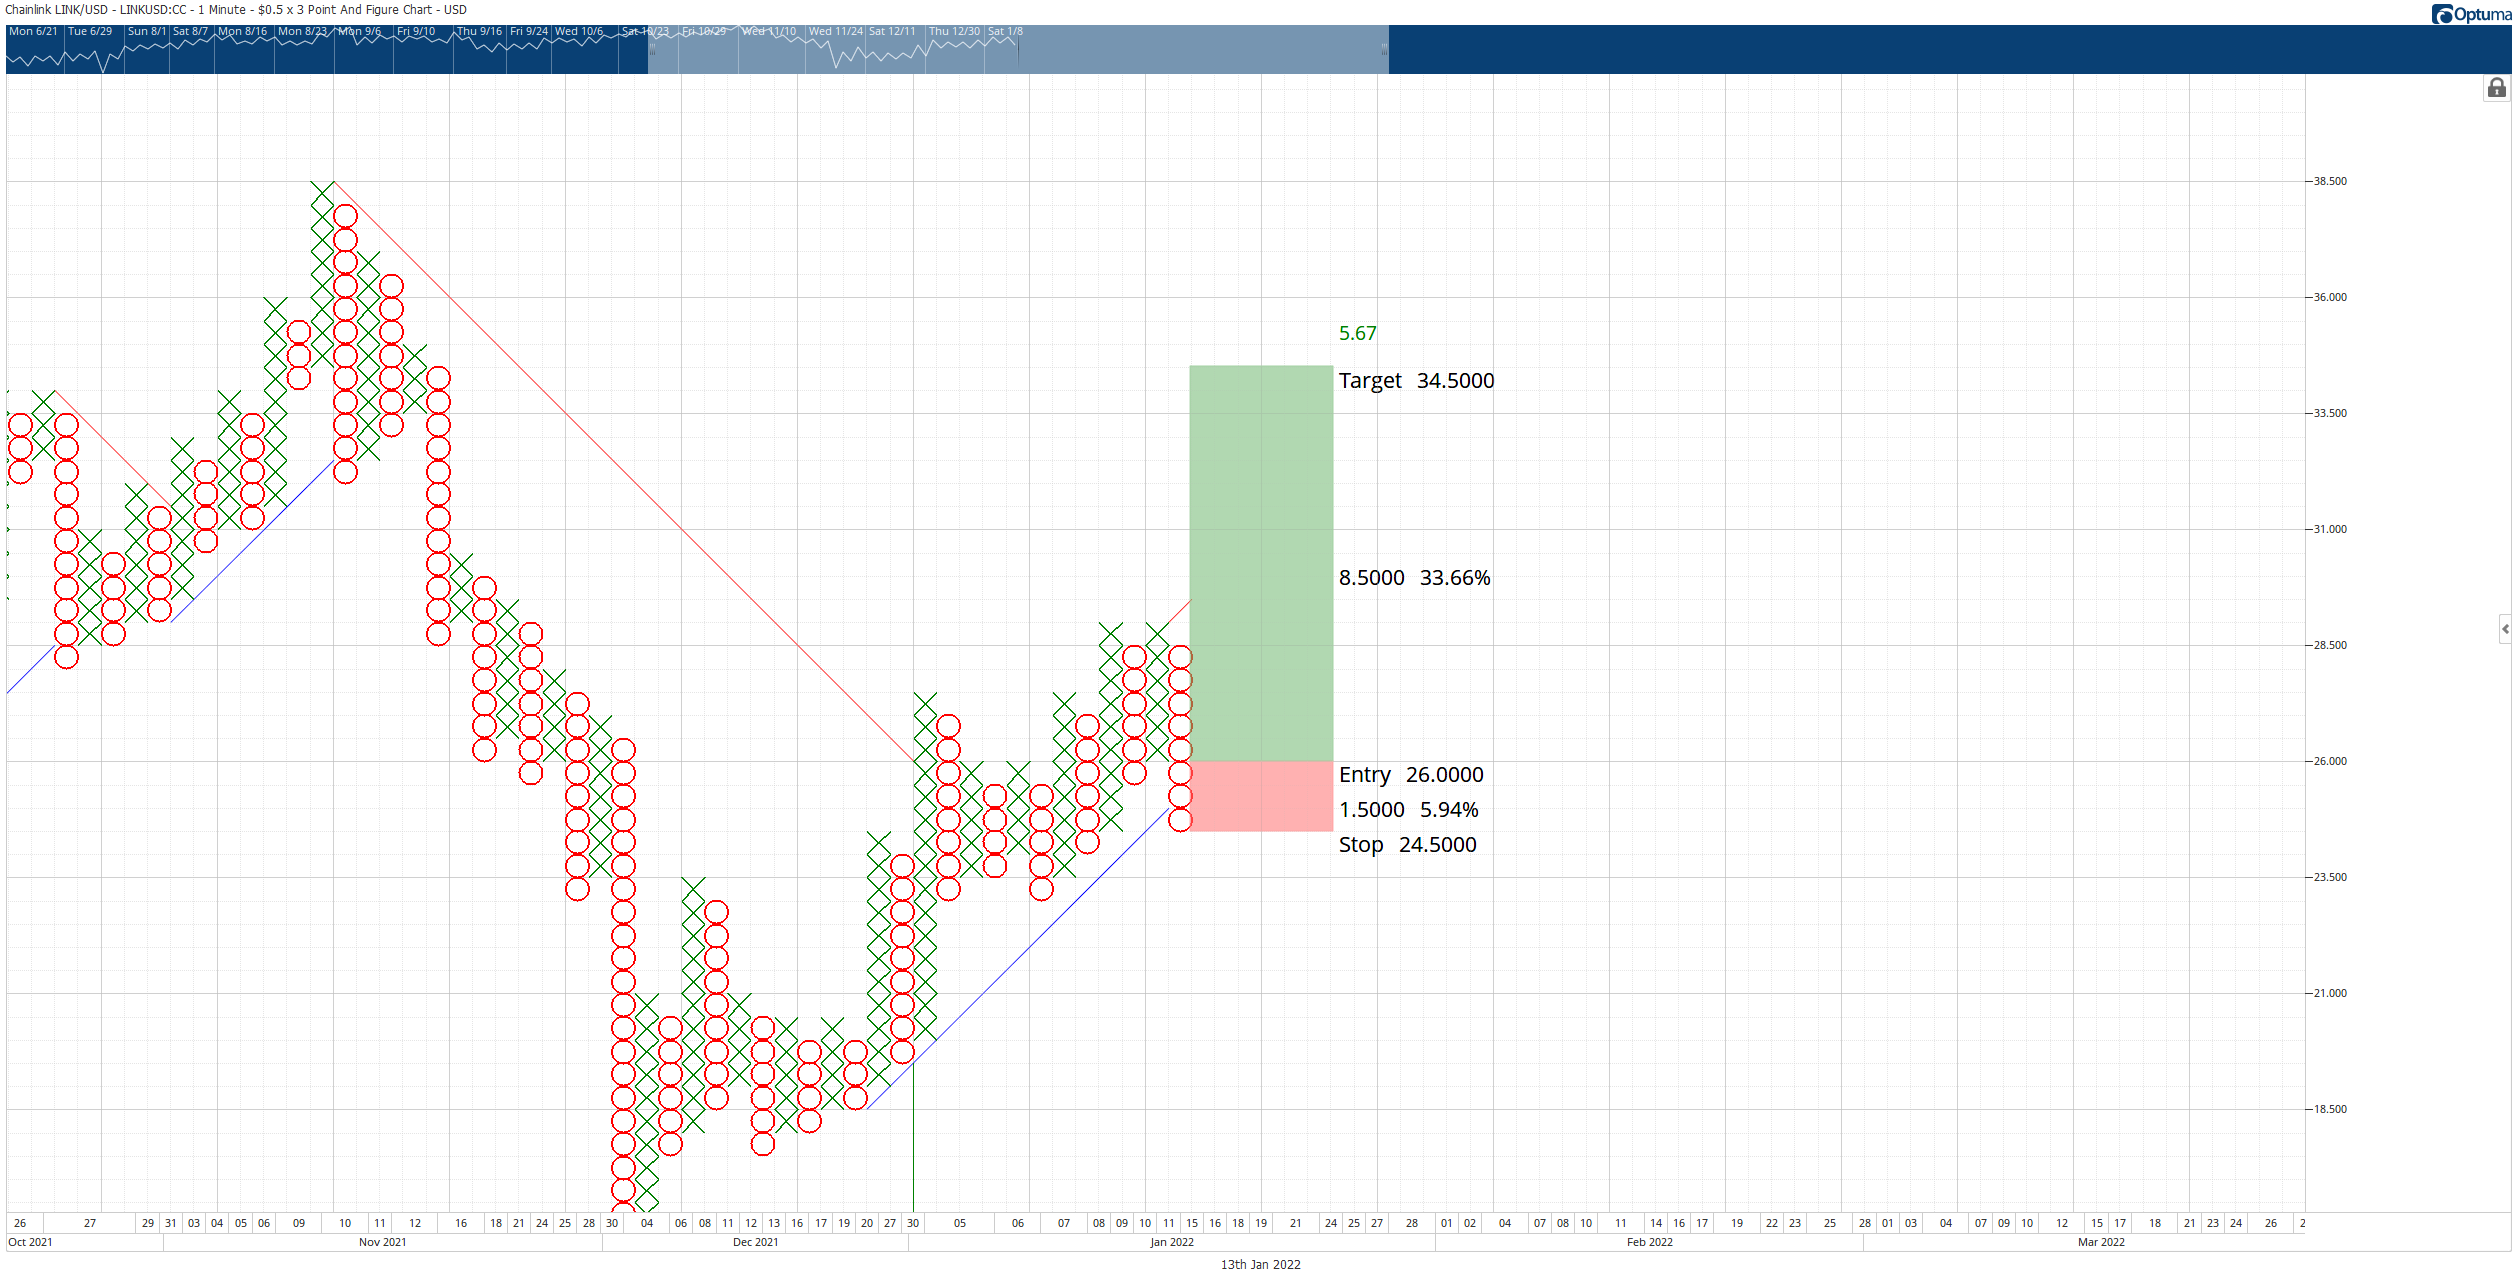
LINK/USDT $0.50/3-box Reversal Point and Figure chart
The long entry idea would invalidate any near-term bearish bias based on resistance found on the weekly chart. The bullish scenario would be invalidated if Chainlink price falls to $23.50.


