
- Chainlink price building a bear flag formation after steep decline through May and June.
- Bearish Death Cross pattern triggered on June 30, increasing the pressure on the digital asset.
- LINK locked below the strategically important 50-week simple moving average (SMA), further amplifying pressures.
Chainlink price has been quietly plotting a bear flag pattern since the June 22 low, tempting investors to buy LINK. Nevertheless, a break below the flag’s lower trend line will trigger the pattern and introduce a renewal of the May-June correction.
Chainlink price so close, yet so far from shining again
Chainlink price has presented investors with a corrective bounce following the 70% decline from the May 10 high of $52.99, putting the cryptocurrency above the descending May trend line. However, the rally has not been impulsive, and volume has been gradually decreasing as it advances. As a result, Chainlink price has formed a bear flag pattern.
Compounding the bearish LINK outlook is that the pattern is developing below the 50-week SMA. It is the first time below the moving average since March 2020 and may confirm a change in the larger uptrend of 2020 and 2021.
Additionally, Chainlink price triggered a bearish Death Cross pattern on June 30 when the 50-day SMA crossed below the 200-day SMA.
The measured move of the bear flag pattern is approximately 30%, projecting a final Chainlink price of $13.00. The decline would smash the support fortified by the May 23 and June 22 lows at $15.00 and potentially drive the daily Relative Strength Index (RSI) into an oversold condition, setting the foundation for a more substantive rebound.
The trigger for the formation is a decline below the flag’s lower trend line, currently at $18.20. Some support may materialize at May’s descending trend line, but the robustness of the formation should carry Chainlink price to the measured move target of $13.00.
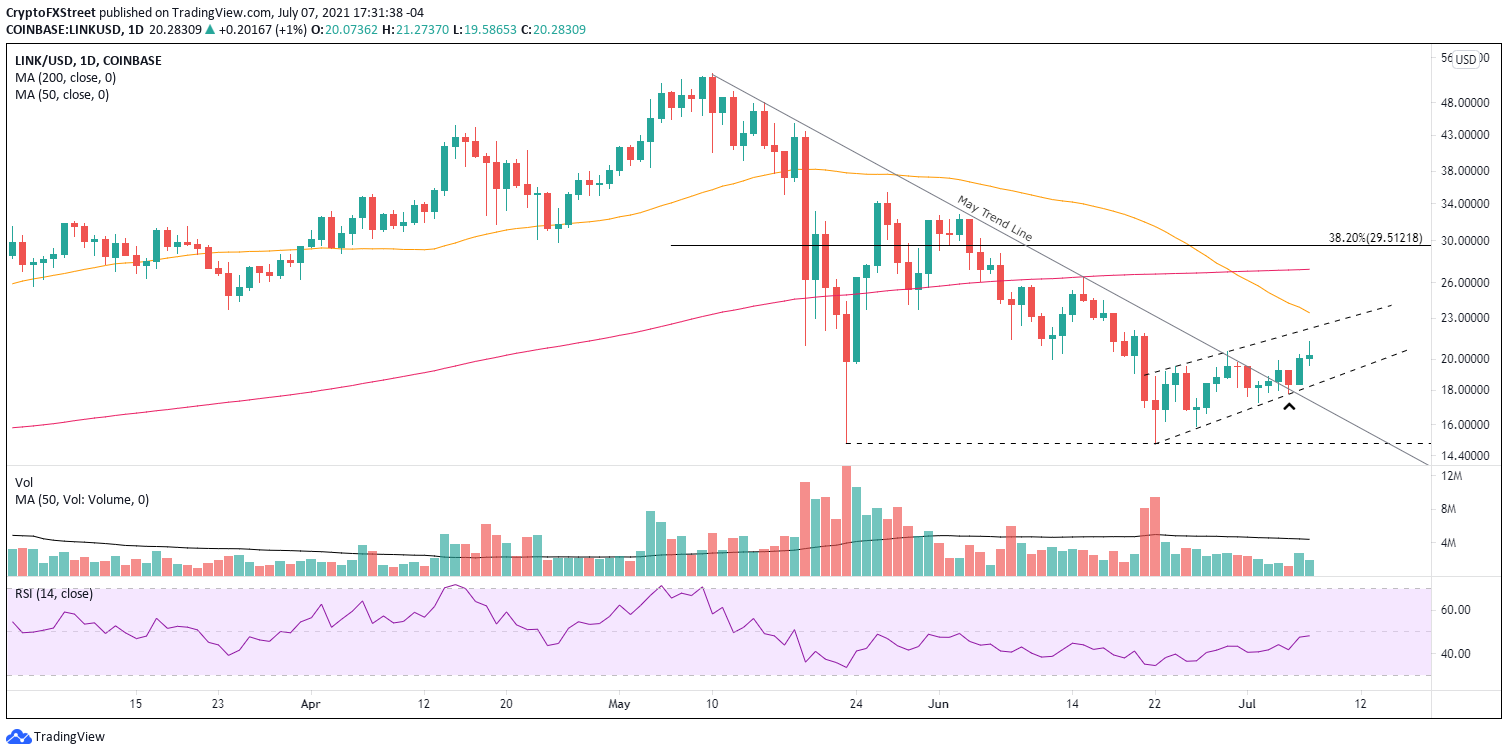
LINK/USD daily chart
Critical to the bear flag thesis is for the resistance vested in the 50-week SMA at $21.06 to hold on a closing basis. If the moving average fails, the bearish outlook would be invalidated, and set Chainlink price free to discover higher prices, including a test of the 50-day SMA at $23.45. A rally to the 200-day SMA at $27.20 remains a low probability event in the short term.
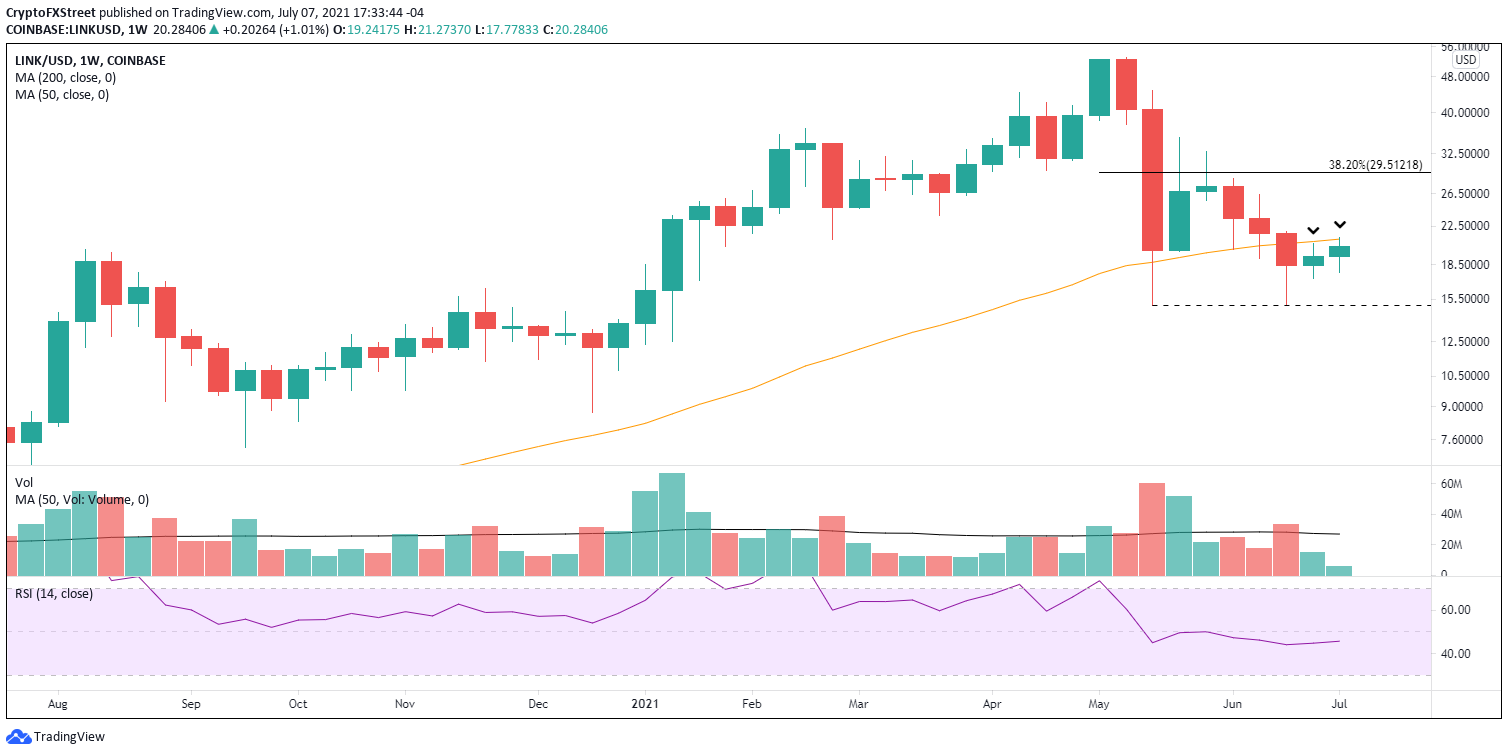
LINK/USD weekly chart
Bear flag patterns are deceptive because they run counter the downtrend suggesting that the cryptocurrency (in this case) has bottomed and is beginning a new, purposeful rally. However, as soon as it looks promising, the bears reappear, steal control and aggressively push the price lower.
At this moment, Chainlink price is at an inflection point in its bear flag pattern. Based on the current price structure, the probabilities are still tilted towards a bearish resolution, erasing the brief shining moment and returning LINK to the hard realities of a bottoming process that follows a rapid, 70% crash.


