
- Dogecoin price sees renewed buying interest, as a new week kicks in.
- DOGE bulls battle 21-DMA within a falling wedge formation on the 1D chart.
- 100-DMA continues to guard the downside amid bullish RSI.
Amid the growing market’s criticism over the centralization of DOGE's supply, the canine-theme-inspired cryptocurrency is attempting to find its feet after the previous week’s sell-off to two-week lows of $0.2661.
Dogecoin price kicks off a brand-new week on a positive note, consolidating Friday’s swift rebound around the $0.29 region, as bulls return this Sunday. Markets viewed Fed Chair Jerome Powell’s Jackson Hole address as not hawkish enough, which fueled a fresh upswing in cryptos on Friday.
Meanwhile, for DOGE price, the recent dry spell of celebrity endorsements has kept buyers on the sidelines. However, with Bitcoin re-attempting the $50,000 threshold, DOGE bulls are trying their luck once again.
The seventh most widely traded coin lost 8% over the last seven days, now adding 1.50% on the day after registering two straight weekly losses.
DOGE/USD: A sustained move above 21-DMA to revive bullish interests
The meme-coin has been forming lower highs and lower lows on the daily chart ever since it peaked at $0.3552 on August 16. This price action in Dogecoin has carved a falling wedge formation, which is usually considered as a bullish continuation pattern.
DOGE bulls need to crack the falling trendline resistance at $0.3127 to yield an upside breakout from the wedge. The buyers will then keep their sight on the $0.35 round figure.
However, for any upside attempts to sustain, DOGE price has to deliver a daily closing above the upwards-loping 21-Daily Moving Average (DMA) at $0.2954, which is currently checking the buying resurgence.
The 14-day Relative Strength Index (RSI) is trading flattish while sitting just above 50.00, lending some support to DOGE bulls.
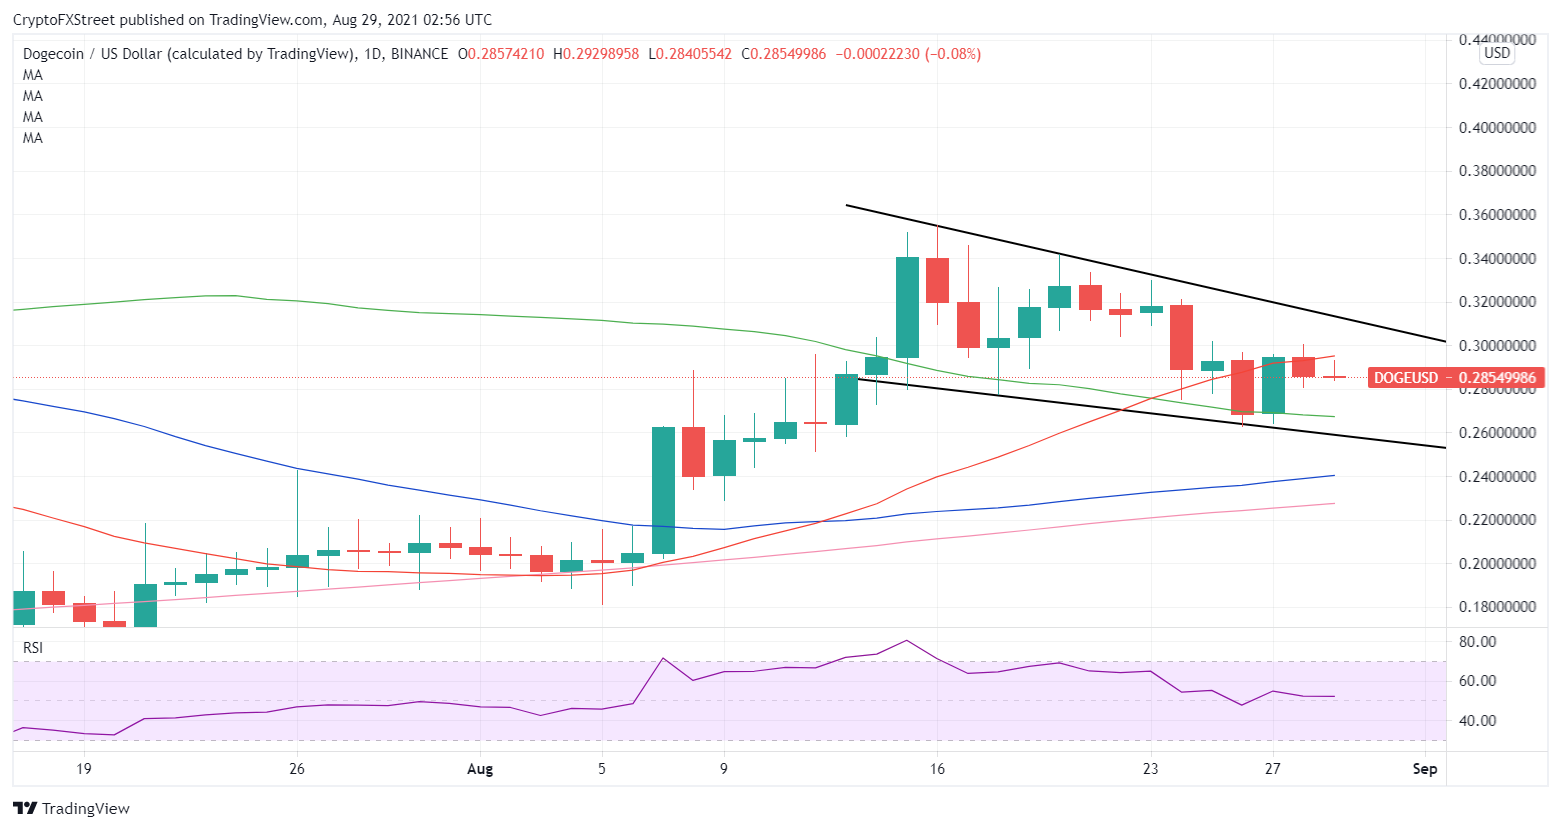
DOGE/USD: Daily chart
Any pullbacks will meet initial demand at $0.2672, where the bearish 100-DMA aligns. Note that the price hasn’t yielded a daily closing below the 100-DMA support line since August 14.
Additional downward pressure could put the falling trendline (wedge) support at $0.2590 at risk.
A sustained move below the latter is likely to open the downside towards the mildly bullish 50-DMA at $0.24.


