
- Dogecoin price eyes a major retracement as it gets rejected at the $0.213 resistance level.
- Transaction data indicates the recent sell-off could exacerbate if DOGE produces a close below $0.20.
- A breach of the $0.230 to create a higher high could invalidate the bearish outlook.
Dogecoin price set up multiple higher highs since July 17 but is currently showing weakness, indicating a shift in trend. On-chain metrics suggest that losing a critical support level might trigger a slew of selling pressure, pushing DOGE lower.
Dogecoin price anticipates a lower high
Dogecoin price was on a clear uptrend since July 17 as the buyers set up two consecutive higher highs. However, the July 26 swing high at $0.233 seems to be the last one since DOGE has dropped roughly 13% from this point to where it currently trades.
Moreover, the $0.213 resistance level has been serving as a major opposing force that has prevented a move higher. The recent rejection on August 1 seems to be leading to a 10% retracement to the $0.183 demand barrier.
A decisive close below this support floor will set up a lower low, confirming the shift in trend to bearish. Such a move will open the path toward the $0.162 foothold, a roughly 20% downswing from $0.205.
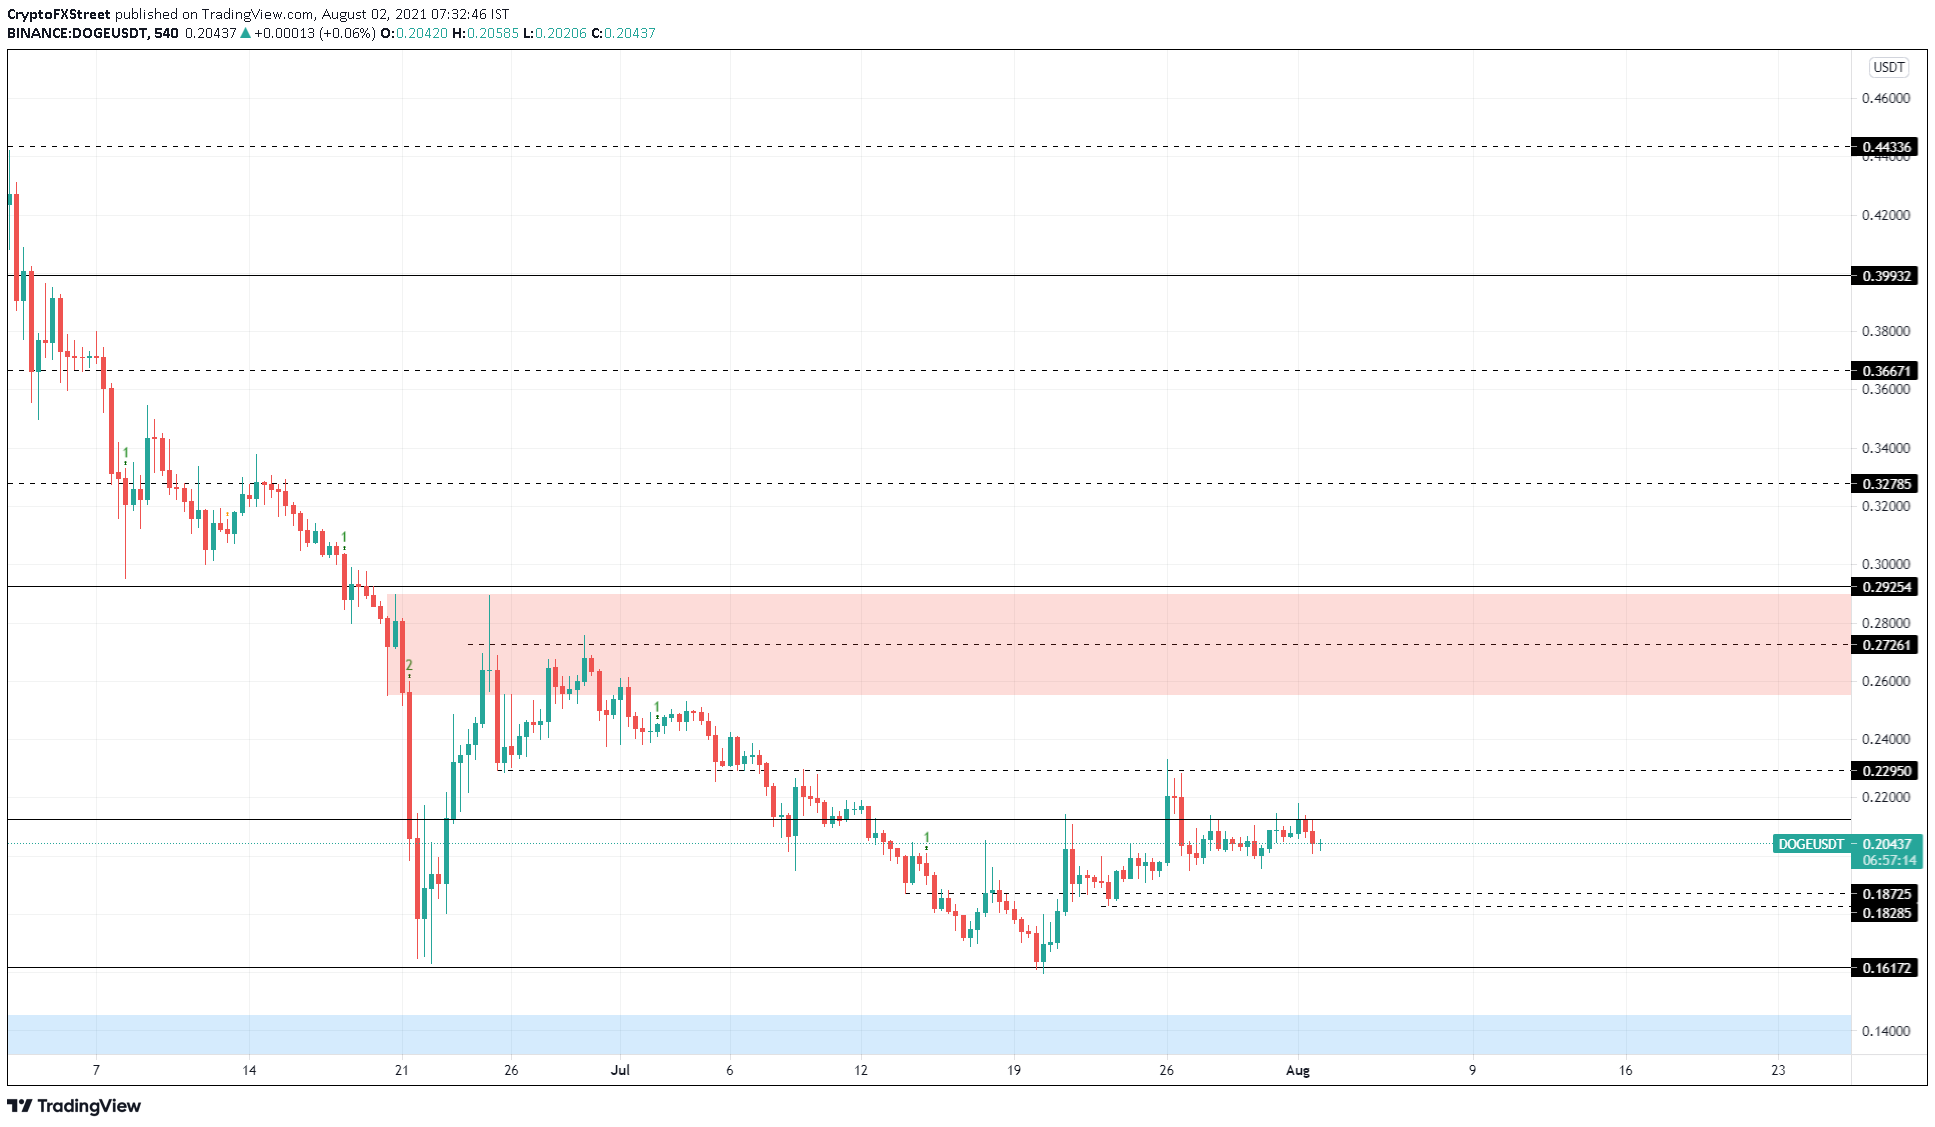
DOGE/USDT 9-hour chart
Supporting this massive downtrend is IntoTheBlock’s Global In/Out of the Money (GIOM) model, which shows that breaching the $0.20 level will push a majority of the investors around this area underwater.
Roughly 144,000 addresses purchased 14.84 billion DOGE at an average price of $0.201. Therefore, a decisive 9-hour candlestick close below this barrier will put these market participants “Out of the Money.” This development might push the holders to sell their holdings at breakeven, adding selling pressure to the already bearish situation and knocking the Dogecoin price lower.
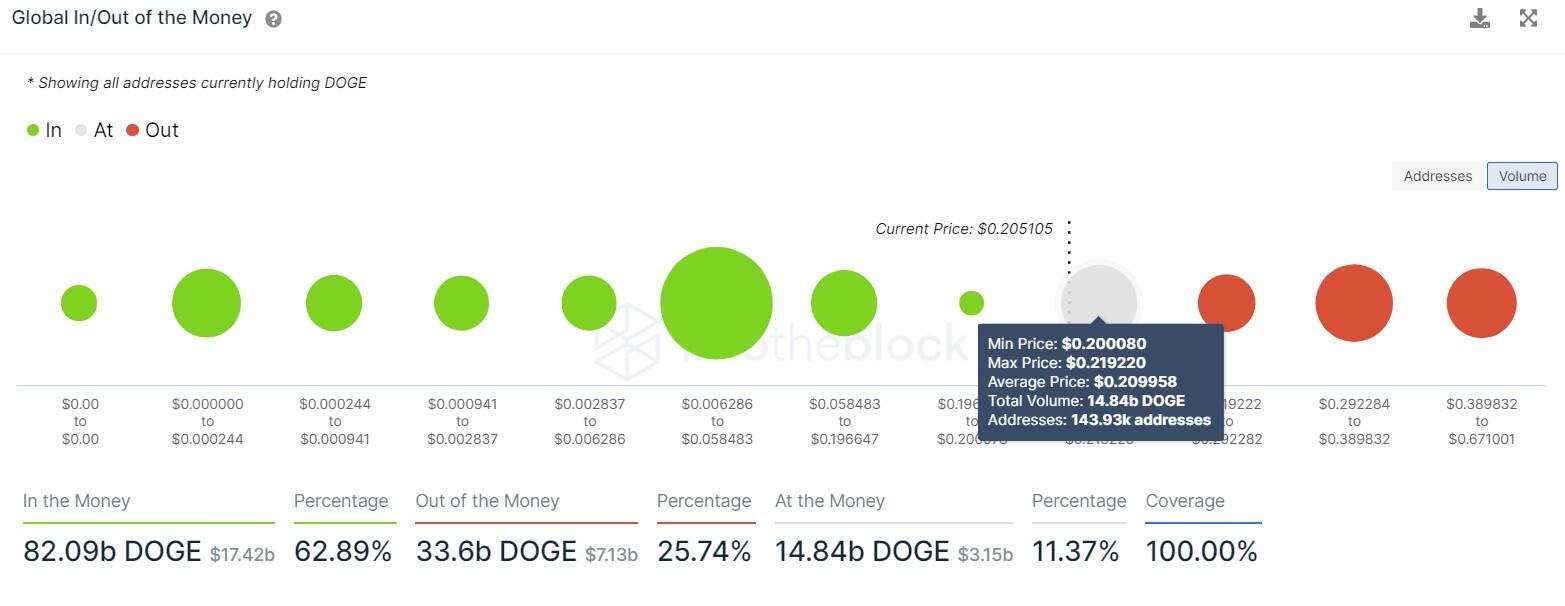
DOGE GIOM chart
Adding a tailwind to the bearish thesis is the large transaction metric, which tracks transactions greater than $100,000. This on-chain indicator paints a clear downtrend from 7,000 to 1,100 over the past three months.
This 84% decline indicates that whales are fleeing the network, suggesting that they are not interested in investing in DOGE.
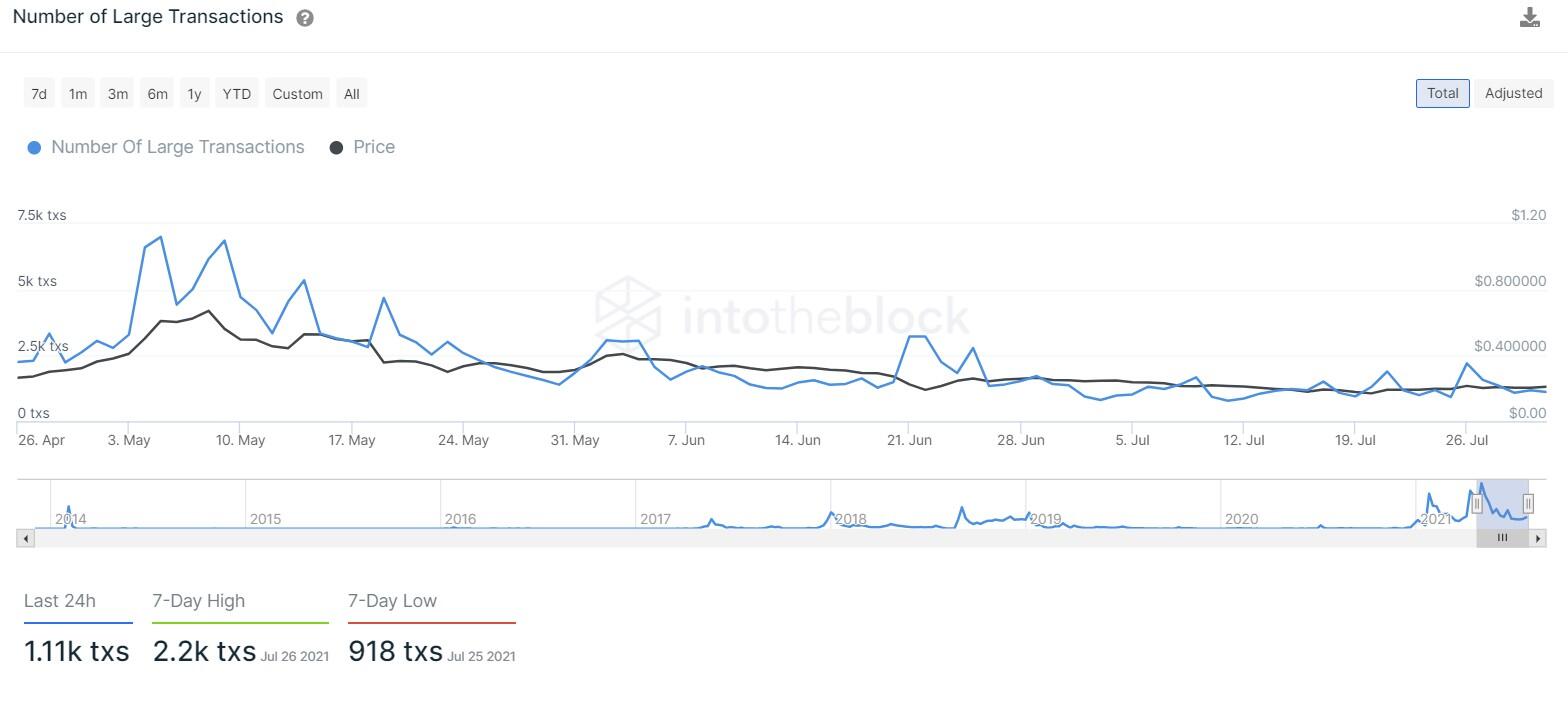
DOGE large transaction chart
Lastly, the daily new addresses joining the meme coin’s network have reduced from 104,000 to 21,500 over the past three months. This 79% plummet indicates that investors are exiting the Dogecoin network, which falls in line with the large transaction metric, painting a bearish outlook for the dog-themed cryptocurrency.
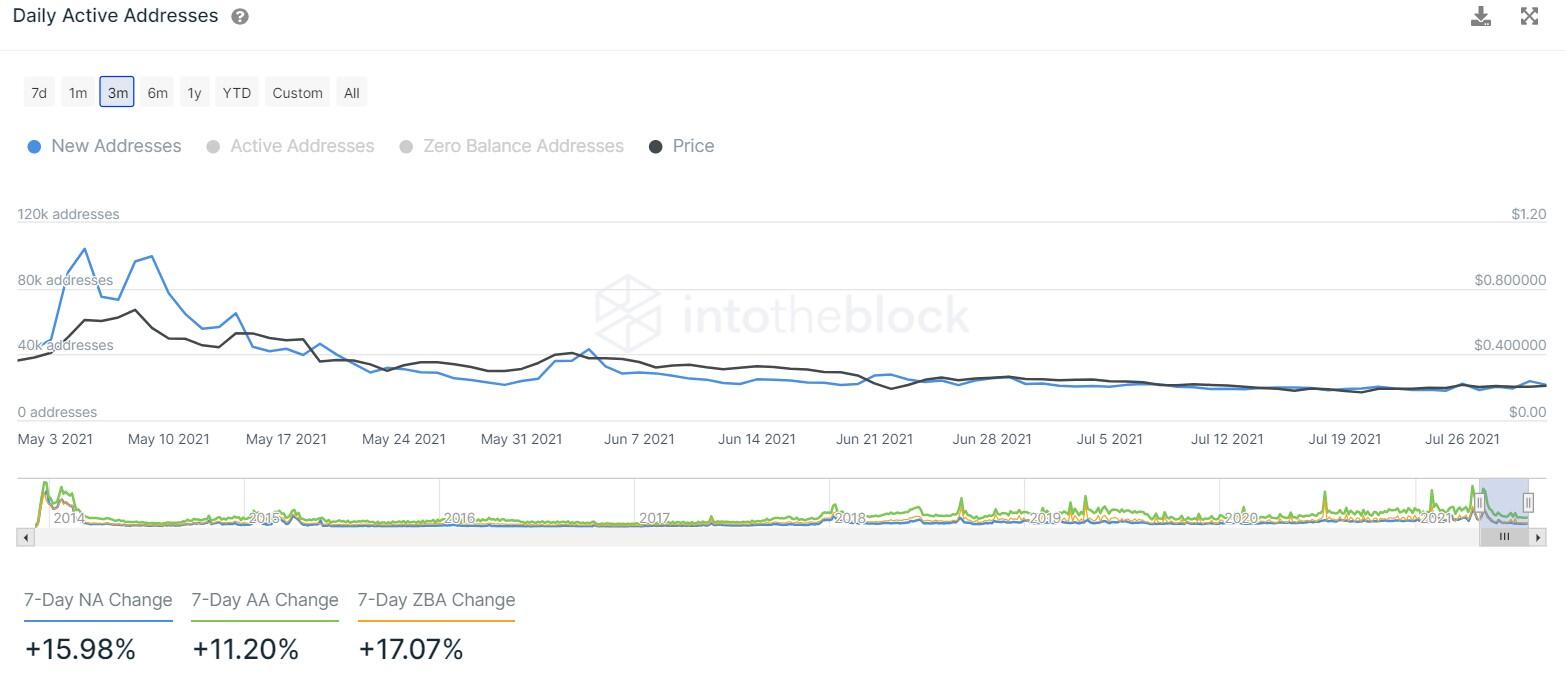
DOGE daily new addresses chart
While things look bleak for Dogecoin price, investors need to note that a decisive close above $0.233 that sets up a new higher high would invalidate the bearish thesis and indicate that the uptrend is back on track.
Such a move opens up the possibility of a retest of the supply zone ranging from $0.255 to $0.290.


