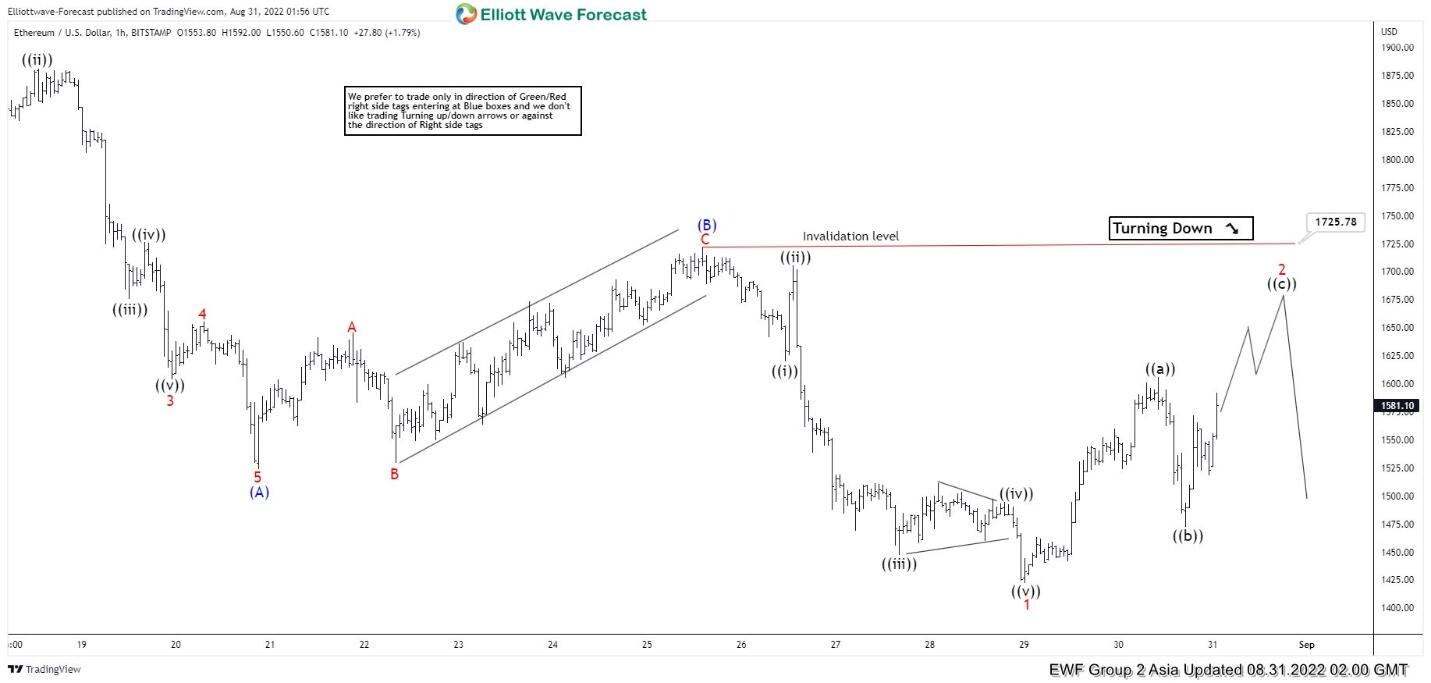
Short Term Elliott Wave View in Ethereum (ETHUSD) suggests that the decline from August 13, 2022 peak is unfolding as a zigzag Elliott Wave structure. Down from August 13 peak, wave 1 ended at $1858.10 and wave 2 rally ended at $1957.30. The crypto currency then extended lower in wave 3 towards $1603.7 and wave 4 rally ended at $1655.10. Final leg lower wave 5 ended at $1524 and this completed wave (A).
Wave (B) bounce ended at $1725.78 with internal subdivision as a zigzag. Up from wave (A), wave A ended at $1645.60 and pullback in wave B ended at $1529.40. Wave C higher ended at $1725.78 which also completed wave (B). The crypto currency has turned lower in wave (C). Down from wave (B), wave ((i)) ended at $1620 and rally in wave ((ii)) ended at $1705.80. Ethereum then extended lower in wave ((iii)) towards $1447.20, wave ((iv)) ended at $1494.90 and wave ((v)) ended at $1422.30 which completed wave 1. Rally in wave 2 is in progress in 3 waves and as far as pivot at $1725.78 stays intact, it can see further downside to end wave (C). If it breaks above $1725.78, then there’s a possibility that the zigzag (A)-(B)-(C) correction is complete. In that case, Ethereum can start to see further rally and break above August 13, 2022 peak.
Ethereum 60 Minutes Elliott Wave Chart