After forming all-time high at 4380.64 on May 12, Ethereum (ETHUSD) has sold off tremendously. In a span of just 8 days, it has dropped more than 50% to today’s low at 1856.86. We are calling the move up to 4380.64 on May 12 as wave III. The pullback to 1856.86 ended wave IV. The internal subdivision of wave IV unfolded as a zigzag Elliott Wave Structure. Down from wave III, wave ((A)) ended at 3117.09, and bounce in wave ((B)) ended at 3570.48. Final leg lower wave ((C)) ended at 1850 which also completed wave IV.
Wave ((C)) of IV completed at the 100% – 161.8% Fibonacci extension of wave ((A)) at 1563 – 2334. The reaction higher from this area has reached 50% of the ((C)) leg, thus traders who bought the pullback at the extreme area above should already have a risk free position. Risk free position means that traders can already take partial profit and move stop loss to the entry level / last low, and thus position should not create a loss in case Ethereum fails to rally.
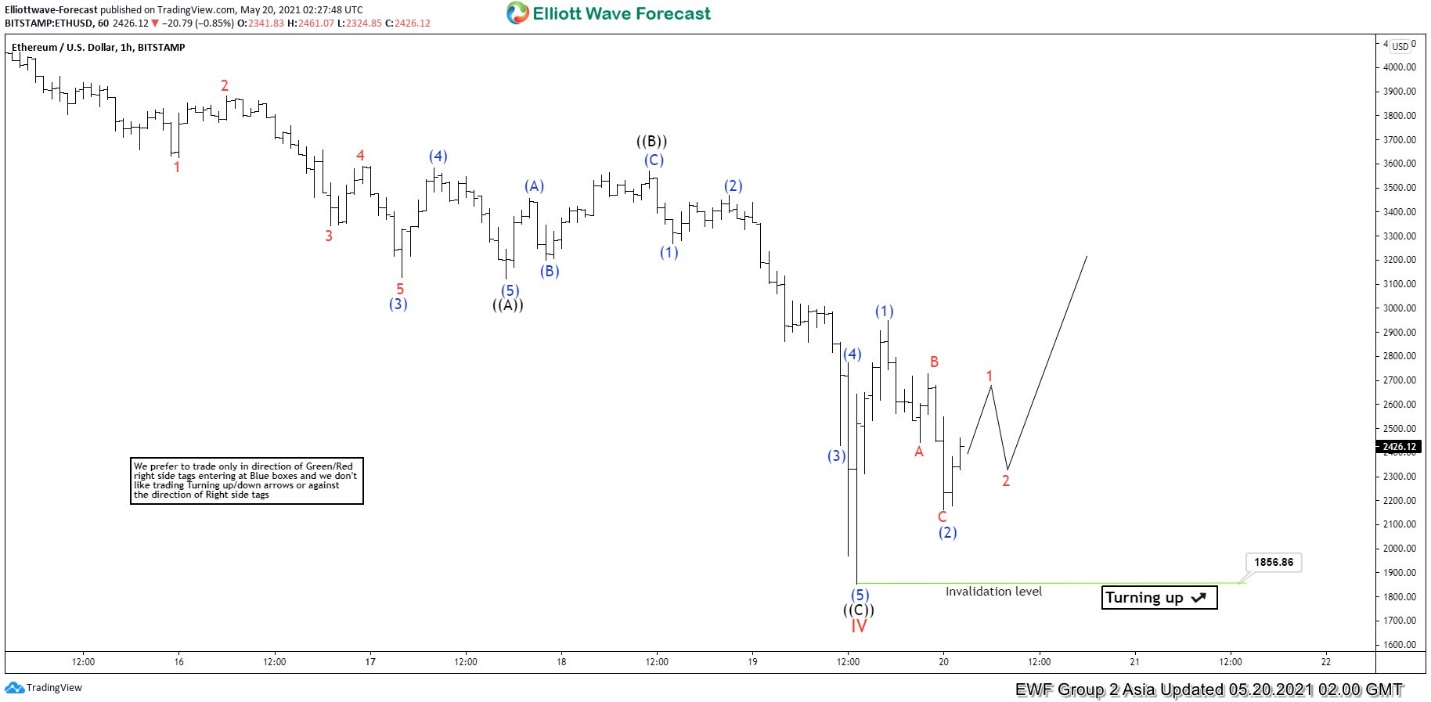
Near term, wave V remains in progress. Up from wave IV, wave (1) ended at 2950 and pullback in wave (2) ended at 2160. As far as pivot at 1856.86 low stays intact, expect ETHUSD to continue to extend higher within wave V.
Ethereum (ETHUSD) 1 Hour Elliott Wave Chart