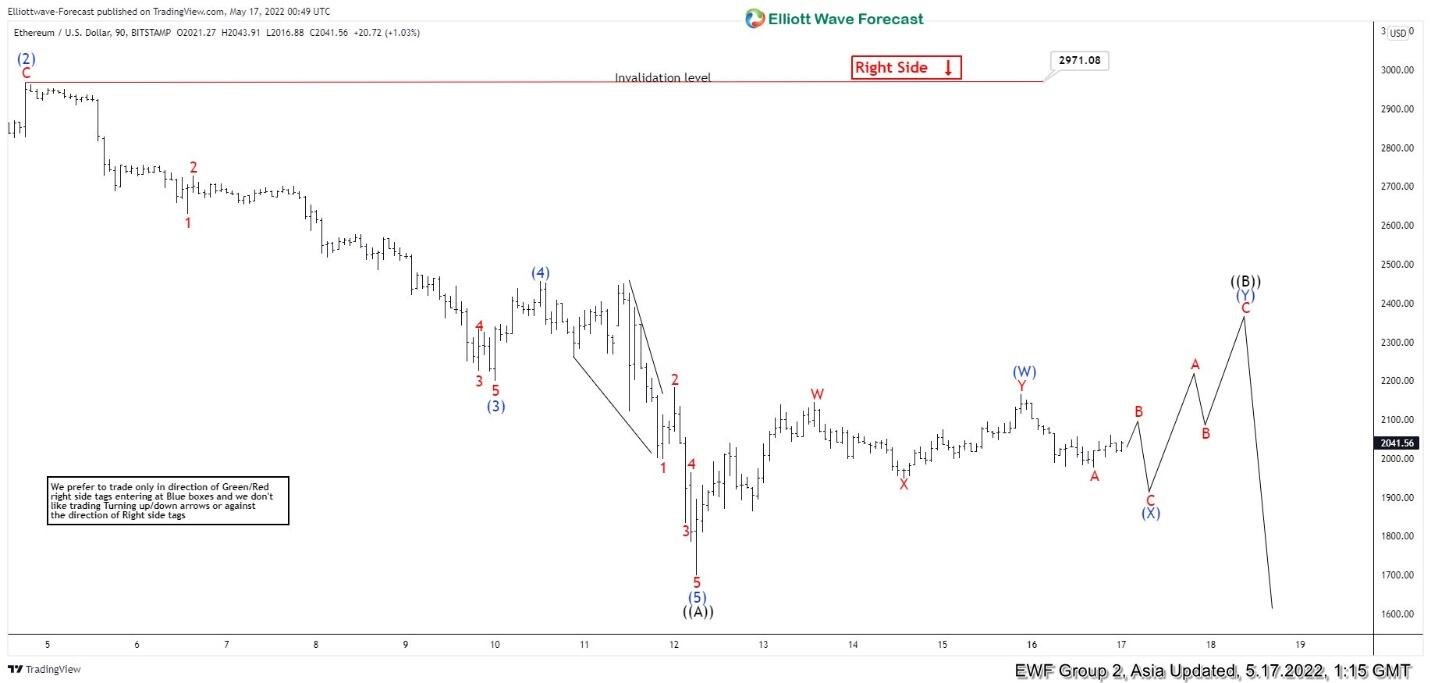
Ethereum shows an incomplete bearish sequence from November 10, 2021 high favoring further downside. The decline from April 3, 2022 high is unfolding as a zigzag Elliott Wave structure. Down from April 3 high, wave (1) ended at 2716.76 and rally in wave (2) ended at 2967.49. The crypto currency then extended lower again in wave (3) towards 2198.78 and rally in wave (4) ended at 2456.66. Final leg lower wave (5) ended at 1700 which completed wave ((A)) of the zigzag.
Wave ((B)) rally is currently in progress to correct cycle from April 3 high before the decline resumes. Internal subdivision of wave ((B)) is unfolding as a double three Elliott Wave structure. Up from wave ((A)), wave W ended at 2145.21 and pullback in wave X ended at 1947.47. Final leg wave Y higher ended at 2165.49 which completed wave (W). Pullback in wave (X) is in progress to correct cycle from May 12 low before it resumes higher in wave (Y) of ((B)). Near term, as far as pivot at 2971.08 high, and more importantly April 3 pivot at 3582.16 high stays intact, expect rally to fail in 3, 7, 11 swing for further downside.
Ethereum 90 Minutes Elliott Wave Chart