Short Term Elliott Wave view in Litecoin (LTCUSD) suggests the decline from November 10, 2021 peak is unfolding as a zigzag Elliott Wave structure. Down from November 10 peak, wave (A) ended at 120.49 and wave (B) rally ended at 154.49. Wave (C) lower is in progress with subdivision as a 5 waves impulse Elliott Wave structure. Down from wave (B), wave ((i)) ended at 133.27 and rally in wave ((ii)) ended at 142.81. The crypto currency extended lower in wave ((iii)) towards 110.01 and rally in wave ((iv)) ended at 116.76. Final leg lower wave ((v)) ended at 96.85 which also completed wave 1.
Wave 2 rally ended at 116.49 at the blue box selling area. This blue box area is based on wave ((c)) = 100% – 161.8% Fibonacci extension of wave ((a)). The internal subdivision of wave 2 unfolded as a zigzag where wave ((a)) ended at 112.74, wave ((b)) ended at 97.61, and wave ((c)) ended at 116.49. This completed wave 2 in higher degree. The crypto currency has turned lower in wave 3 but it still needs to break below wave 1 at 96.85 to rule out a double correction. Down from wave 2, wave (i) ended at 103.41 and wave (ii) ended at 110. Near term, as far as rally fails below wave 2 high at 116.49, and more importantly below 154.49, expect further downside.
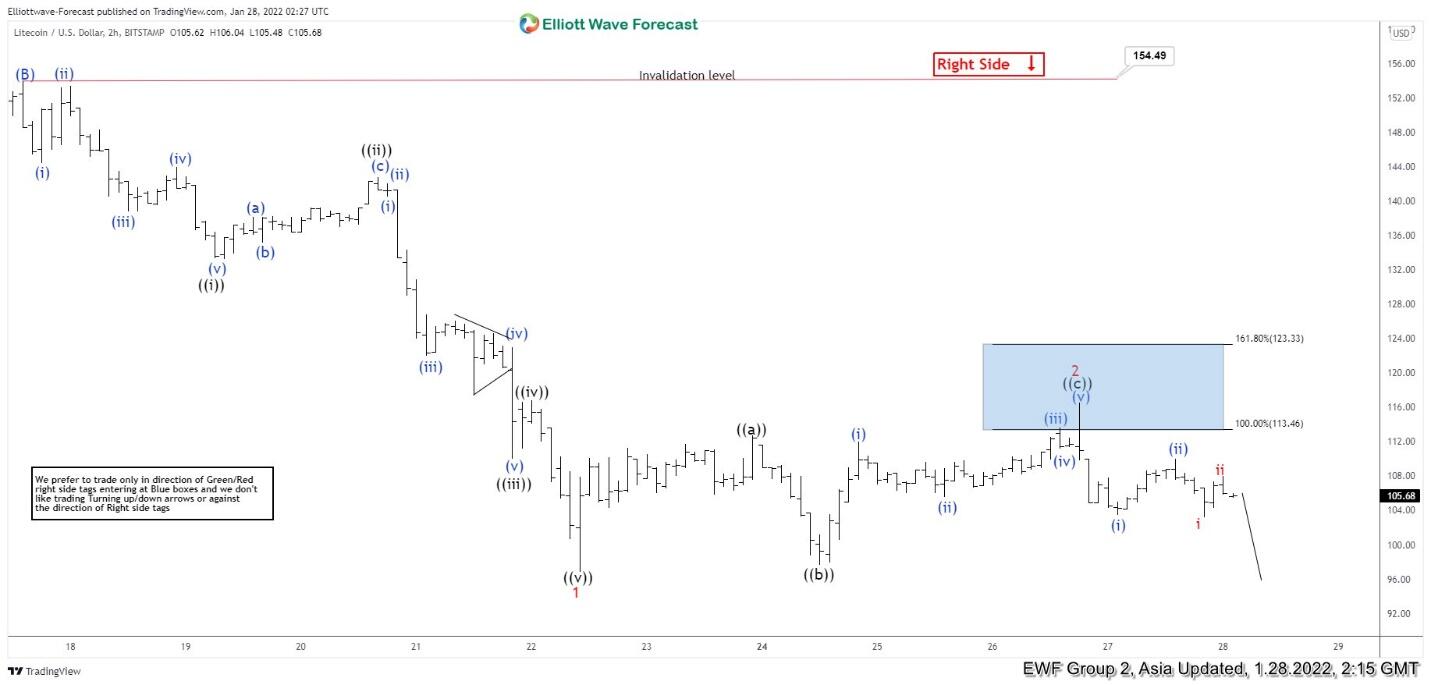
Litecoin 2 hours Elliott Wave chart