
- Ethereum Classic price engages the July ascending trend line for the second time in four days.
- ETC will fail to close with five consecutive positive weeks, a feat it has not accomplished since April 2020.
- The 50-day simple moving average (SMA) is the last line of defense for the new rally.
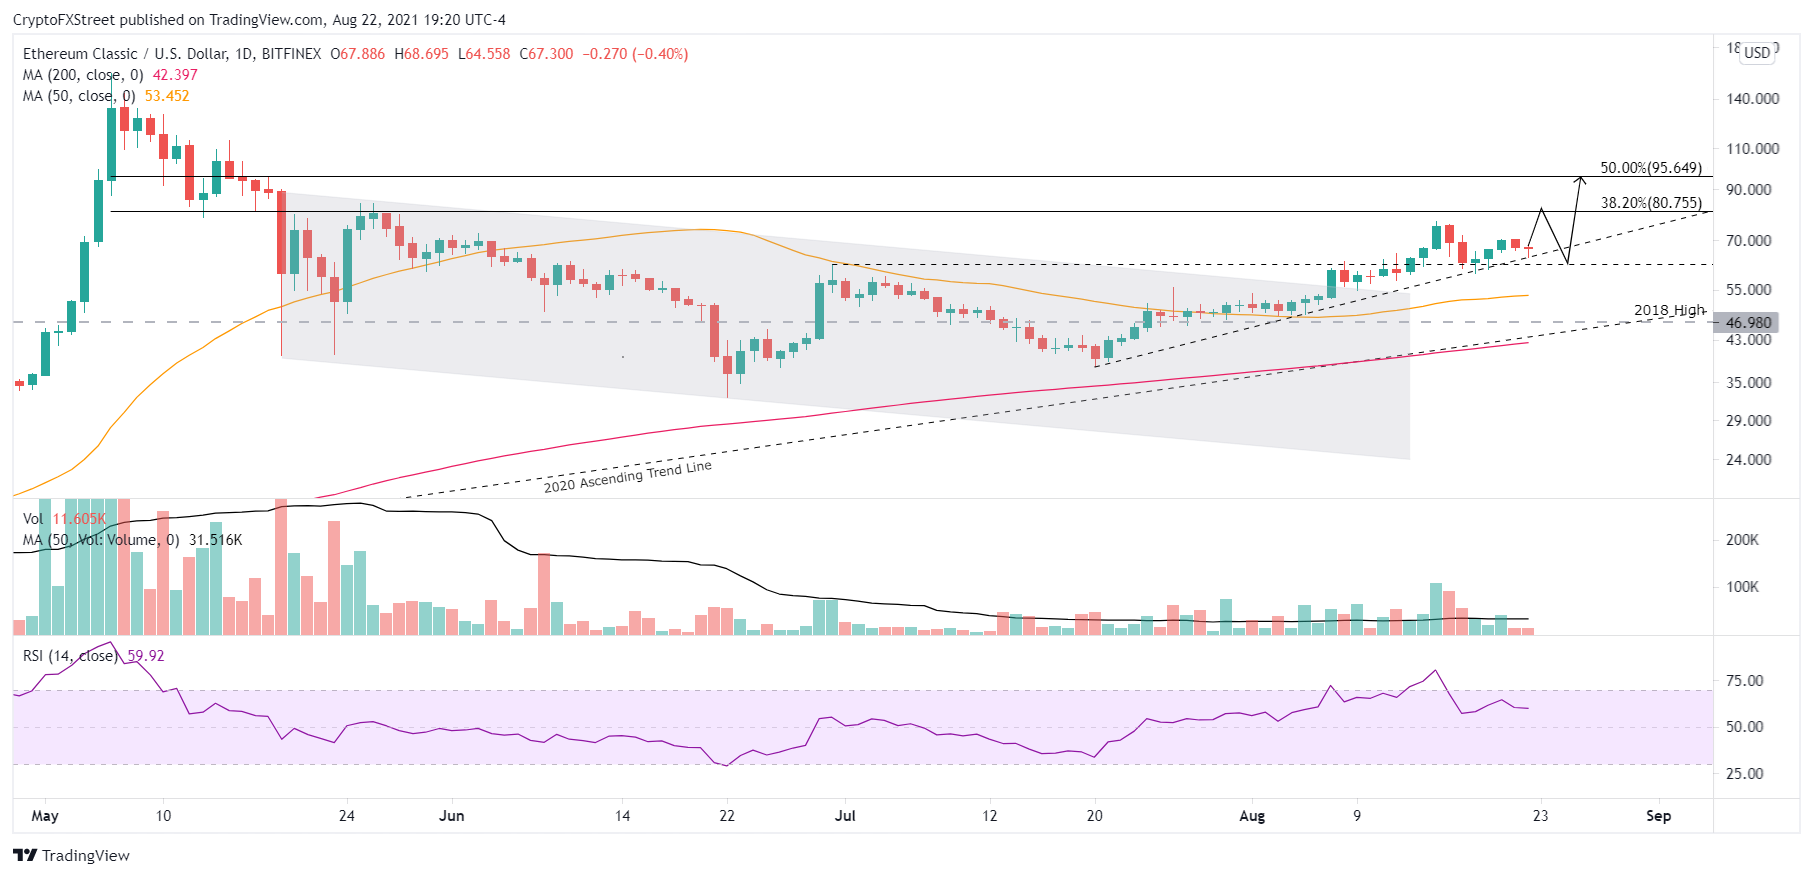
Ethereum Classic price has failed to reach the 38.2% Fibonacci retracement at $80.75, a fundamental level of resistance for the move that has totaled over 100% from the July 20 low. With the July ascending trend line providing support, coupled with the nearby support directed by the June 30 high of $62.45, ETC should engineer a new attempt to touch the Fibonacci level before undergoing a complete pullback.
Ethereum Classic price nears pivotal level
Ethereum Classic price shows a 31.21% gain for August at the time of writing, making it the best August performance since 2016 and, more importantly, unlocking ETC from the magnet effect of the 2018 high at $46.98 that fluctuated as support or resistance during May and June. It is was a bullish milestone for the altcoin.
One of the reasons for the noteworthy rally and convincing breakaway from $46.98 was the constructive position of Ethereum Classic price when the move began. ETC was above the 200-day SMA, the 50-week SMA and the 2020 ascending trend line. Moreover, it was not battling the downward pressure associated with a bearish Death Cross pattern.
Moving forward, Ethereum Classic price is not showing a bearish momentum divergence on any time frame at the August 15 high, suggesting that ETC can extend the rise to the 38.2% retracement at $80.75, marking a 20% gain from the current price. It becomes more complicated after $80.75 as the level is reinforced by highs in late May and lows printed on May 12 and 13. Thus, newcomers to ETC are not presented with a timely opportunity and are best served to wait for a quality pullback in time or price before opening a position.
ETC/USD daily chart
The bearish alternative is that Ethereum Classic price falls below the July ascending trend line and the June 30 high of $62.45. The breakdown would project at a test of the rising 50-day SMA at $53.45, representing an almost 20% decline from the current price. However, the recent rally would still be intact.
Ethereum Classic price structure is solid, but it should be mentioned that the cryptocurrency heavyweights, Bitcoin and Ethereum, do exhibit a bearish momentum divergence on their daily charts, presenting a possible obstacle for ETC.
Here, FXStreet's analysts evaluate where ETC could be heading next as it holds on critical support.


