
- Ethereum Classic price loses the critical support at $47.00 after declining -15.7% for the week.
- The midline of descending parallel channel propping up ETC, generating a brief moment of relative strength.
- Credible support rests with the 200-day simple moving average (SMA) at $34.11.
Ethereum Classic price is flat on the trading day, while the broader cryptocurrency complex is trading down, with individual losses reaching -11%. It is an interesting point of relative strength, but when a .34% gain is placed in the context of a 35% decline since the June 30 high, it doesn’t represent a trend change. As a result, the ETC price structure remains insecure, with a clear bias for further downside in the coming days.
Ethereum Classic price trying to fool investors, but remain wary
At the May 6 high of $158.76, Ethereum Classic price was a remarkable 377% above the tactically important 50-day SMA, easily besting the previous maximum deviation of 238% in May 2017. On a weekly basis, ETC reached an unprecedented deviation from the 50-week SMA of 900%. The response was an 80% collapse, pushing ETC down to $32.53 on June 22 and a negative deviation from the 50-day SMA of -50%.
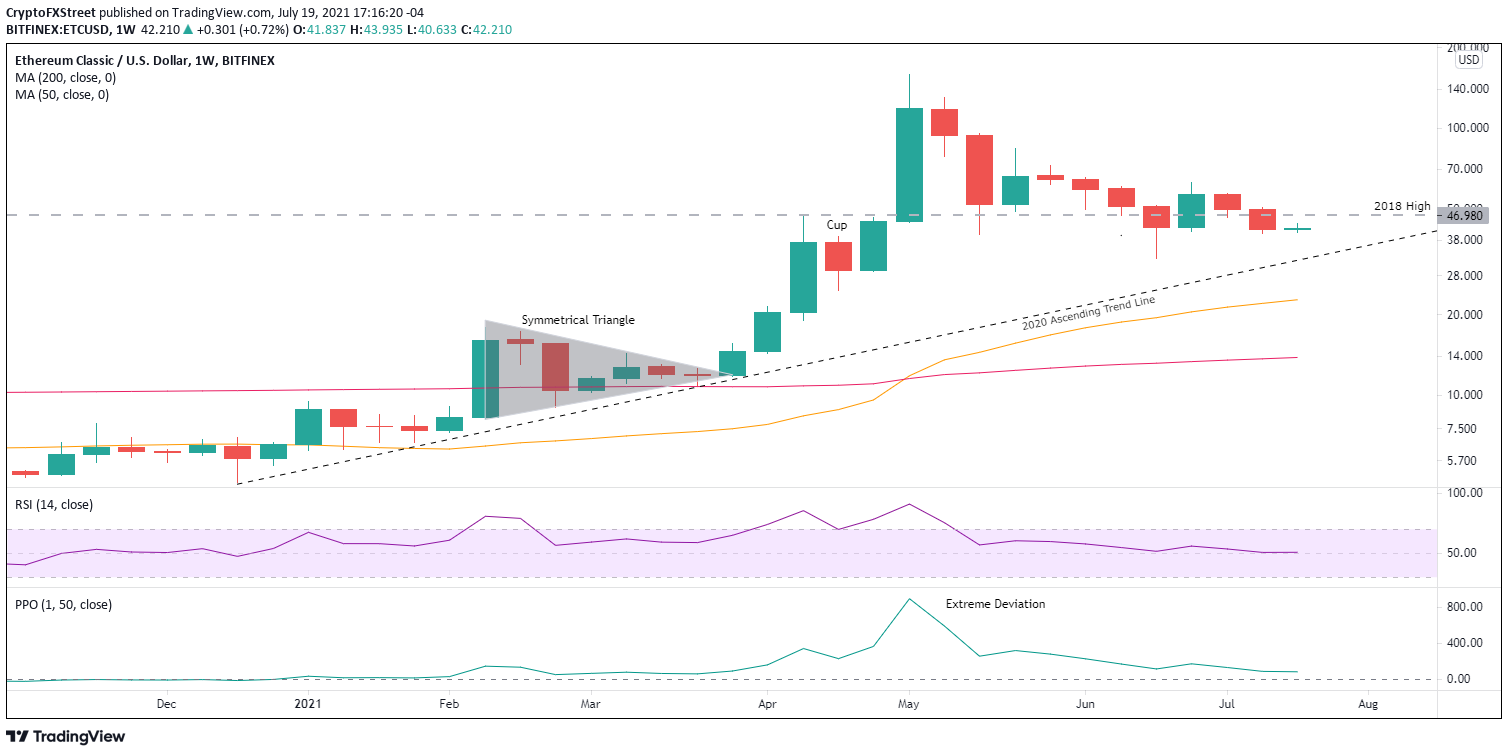
ETC/USD weekly chart
Ethereum Classic price matched the 80% decline with a 90% spike, highlighted by a 30.87% gain on June 29 that catapulted ETC back above the critical 2018 high of $46.98. However, the comfort of the 2018 high was disrupted on July 8 with a close below. Since the failure to hold $46.98, Ethereum Classic price has fallen in tandem with the cryptocurrency complex before catching a bid around the midline of the descending parallel channel at $39.21.
The mild bounce over the last three days is strictly corrective and does not interfere with the bearish price structure presented by Ethereum Classic price. The most prominent support is the 200-day SMA at $34.11, equating to an 18% decline from the current price. The next visible and crucial support is the confluence of the June 22 low of $32.53 with the 2020 ascending trend line at $31.90. A failure to hold on a weekly closing basis would be a blow to ETC and put the altcoin on pace to test the lower range of the channel at $26.80, representing a 35% loss from the current price.
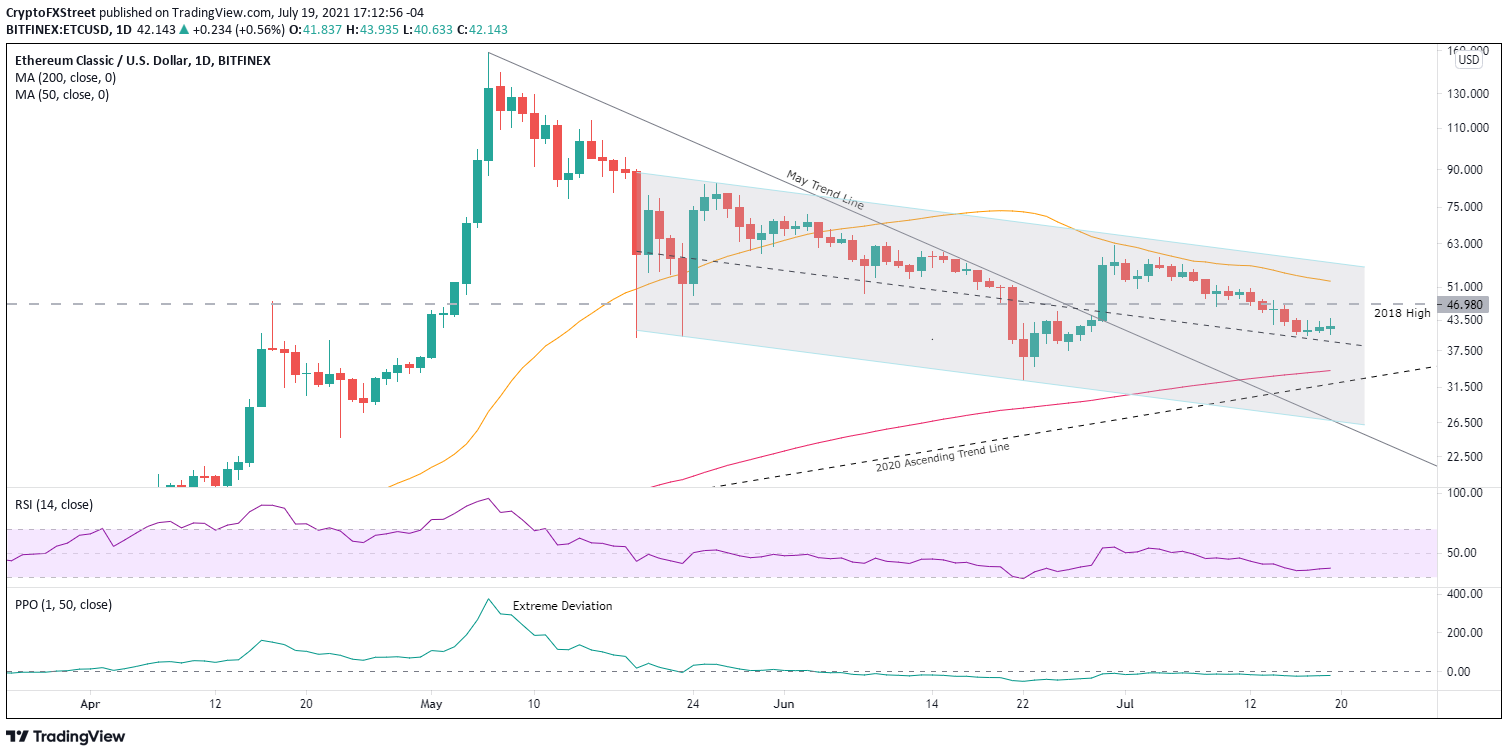
ETC/USD daily chart
To contemplate higher prices, Ethereum Classic price needs to reclaim the 2018 high of $46.98 on a daily closing basis, not on an intra-day basis. If successful, the ETC rally will still be aggravated by the 50-day SMA at $52.51, followed by the upper range of the descending parallel channel at $57.50, representing a 20% gain from the 2018 high.
Another upside target of note is the June 30 high of $62.45.
Ethereum Classic price is trying to fool investors with a hint of relative strength in a market dominated by red. It may compel a few to enter the market, but the faint price strength demonstrates that the midline of the descending parallel channel is not excellent support. Instead, ETC will likely collapse to the 200-day SMA at $34.11, where an impulsive rally can commence.
Here, FXStreet's analysts evaluate where ETC could be heading next.


