
- Ethereum price discovers resistance at the 50-day simple moving average (SMA) after notable rebound from the May 23 low.
- February 20 high needs to hold any further weakness that may materialize moving forward.
- ETH on-chain metrics create a mixed outlook for the digital asset, suggesting that the timing is not right for a rally continuation.
Ethereum price is struggling to recover the relative strength that dominated the April-May period, as the response to last week’s 41.44% decline has been muted. Until ETH can motivate sustainable price traction above the 50-day SMA and the double bottom trigger, the smart contract giant will be dominated by bewildered price action.
Ethereum price strength fundamental to a broader recovery for the crypto market
Ethereum price rallied almost 60% from the May 19 low at $1,900 into the May 20 high at $2,999 before falling to a new correction low on May 23 at $1,728. A 70% bounce followed the new low to the May 26 high.
A bullish hammer candlestick on the 12-hour ETH chart initiated the rebound on May 23 after printing an oversold reading on the daily Relative Strength Index (RSI). It was accompanied by above-average volume. Moreover, the May 23 undercut of the May 19 low has established a double bottom pattern with a trigger price of $3,000.
The consecutive sharp rebounds have frustrated the bearish narrative and built-up price compression that needs to be released through pullbacks, such as the previous three days. Once complete, Ethereum price may be unfettered to test the double bottom trigger price.
A breakout above the double bottom trigger of $3,000 will quickly reach resistance at the 61.8% Fibonacci retracement of the May correction at $3,369. If the rally continues, Ethereum price will identify minor resistance at the 78.6% retracement at $3,815 before ETH is propelled to the all-time high at $4,384.
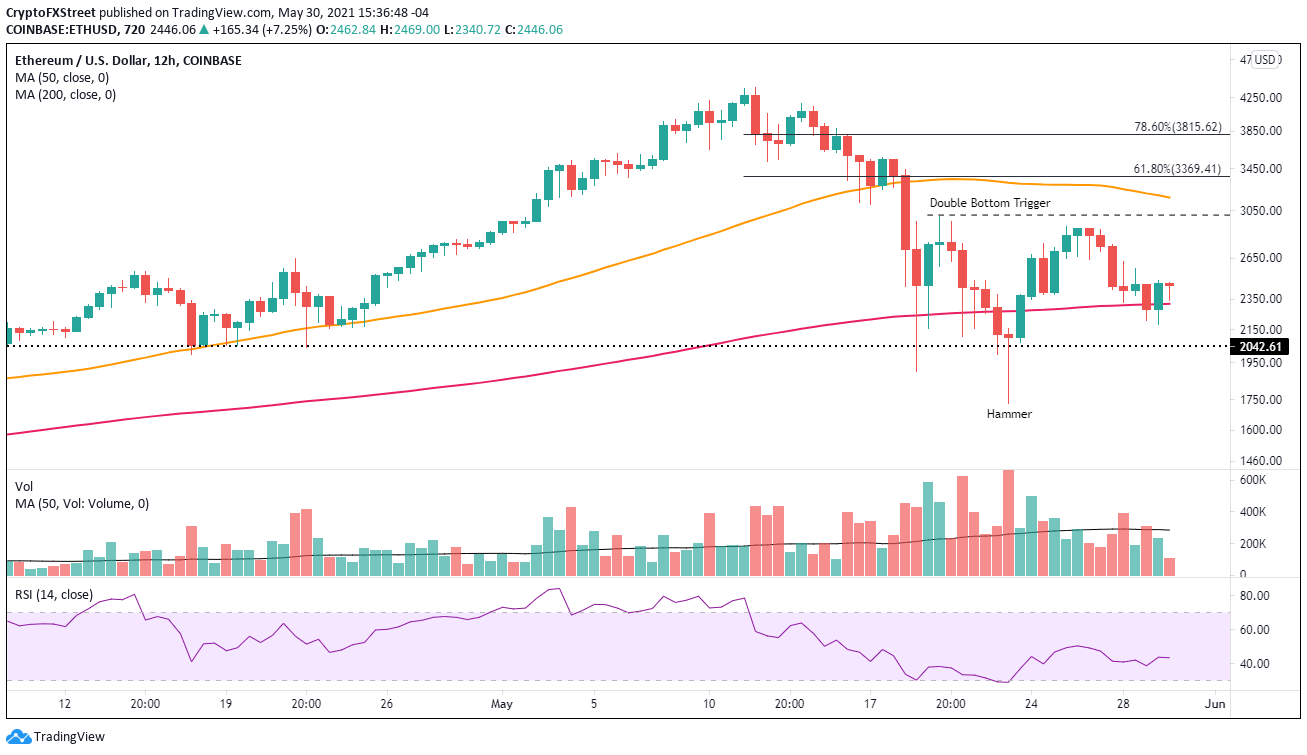
ETH/USD 12-hour chart
Ethereum price could lose the grip on the support framed by the 200 twelve-hour SMA at $2,318, risking a new test of the February high of $2,042. A daily close below the imposing level will downgrade the outlook to negative and raise the probability that ETH will sell down to the strategically important 200-day SMA at $1,657. Prominent investors and the growing number of institutions should be motivated to use the level to begin accumulating in size.
On-chain metrics question a bullish narrative
Based on the IntoTheBlock In/Out of the Money Around Price (IOMAP), there is a cluster of resistance (out of the money) above the current price that includes 182.94k addresses holding 6.88 million ETH at an average price of $2,527. It is followed by another cluster of 379.52k addresses holding 3.39 million ETH at an average price of $2,582.
In terms of support (in the money), there is marginal protection down to the February high of $2,042, supporting a case for another test of the pivotal support.
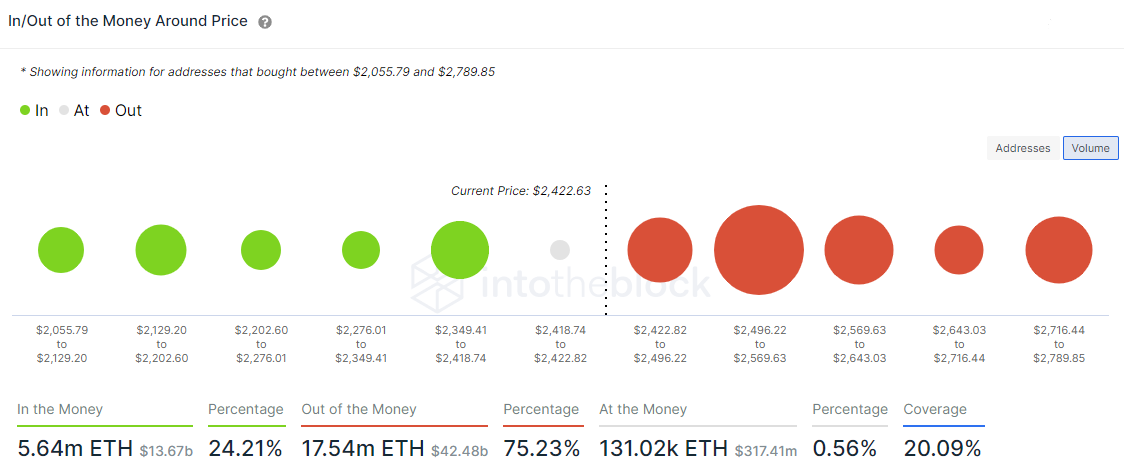
ETH IOMAP
The Santiment 30-day Market Value Realized Value (MVRV) metric does show a negative reading, indicating that Ethereum is undervalued at the current price levels. However, in terms of opportunity, the 30-period moving average remains in the overvalued range. In the past, the 30-period moving average has declined to at least fairly valued, and more often, undervalued before a sizeable rally developed.
Before taking a position, it would be opportunistic to wait for the moving average to reach fair to undervalued levels and then for the 30-day MVRV metric to rise above the moving average. ETH still needs weakness and time to create a similar buy signal.
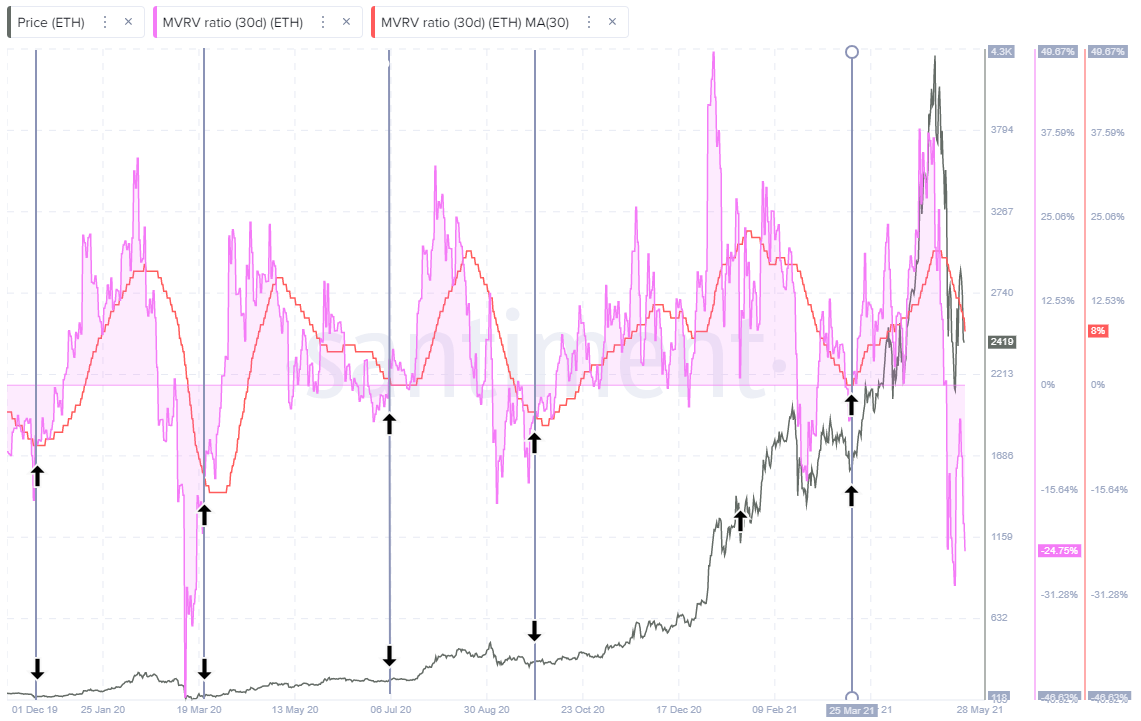
ETH 30-day MVRV
ETH is at a crossroads as the IOMAP data implies that Ethereum price faces significant resistance at current levels. A continuation of the pullback is a high probability in the short term. Meanwhile, the MVRV metric moving average is not near previous levels that coincided with important rallies. A further price retreat would put the MVRV metric moving average at levels consistent to prior lows, thereby establishing an actionable timing signal for the cryptocurrency.


