
- Ethereum price is currently hovering above a crucial resistance level at $2,018.
- A continuation of the uptrend will push ETH past the trading range’s midpoint at $2,297 and toward $2,500.
- On-chain metrics show a path of least resistance for this journey the bulls are embarking on.
Ethereum price has sliced through vital supply barriers to assert dominance and reveal that bulls are back in town. ETH is likely to tag a psychological level, and on-chain metrics indicate clear skies for the smart contract token.
Ethereum price clears two major hurdles
Ethereum price came very close to testing the range low at $1,700, but the resurgence of bulls at the right time enforced that a trend reversal ensues. Since the July 20 swing low at $1,706, ETH has rallied roughly 21%, slicing through the $2,018 resistance level and collecting the buy liquidity resting above July 15 swing highs at $2,042.
As Ethereum price trades around $2,058, bulls are eyeing a retest of the 50% Fibonacci retracement level at $2,297. Clearing this hurdle will open the path for the smart contract token to journey through a cluster of resistance levels to tag $2,500. Such a move, if it occurs, will be another 21% ascent.
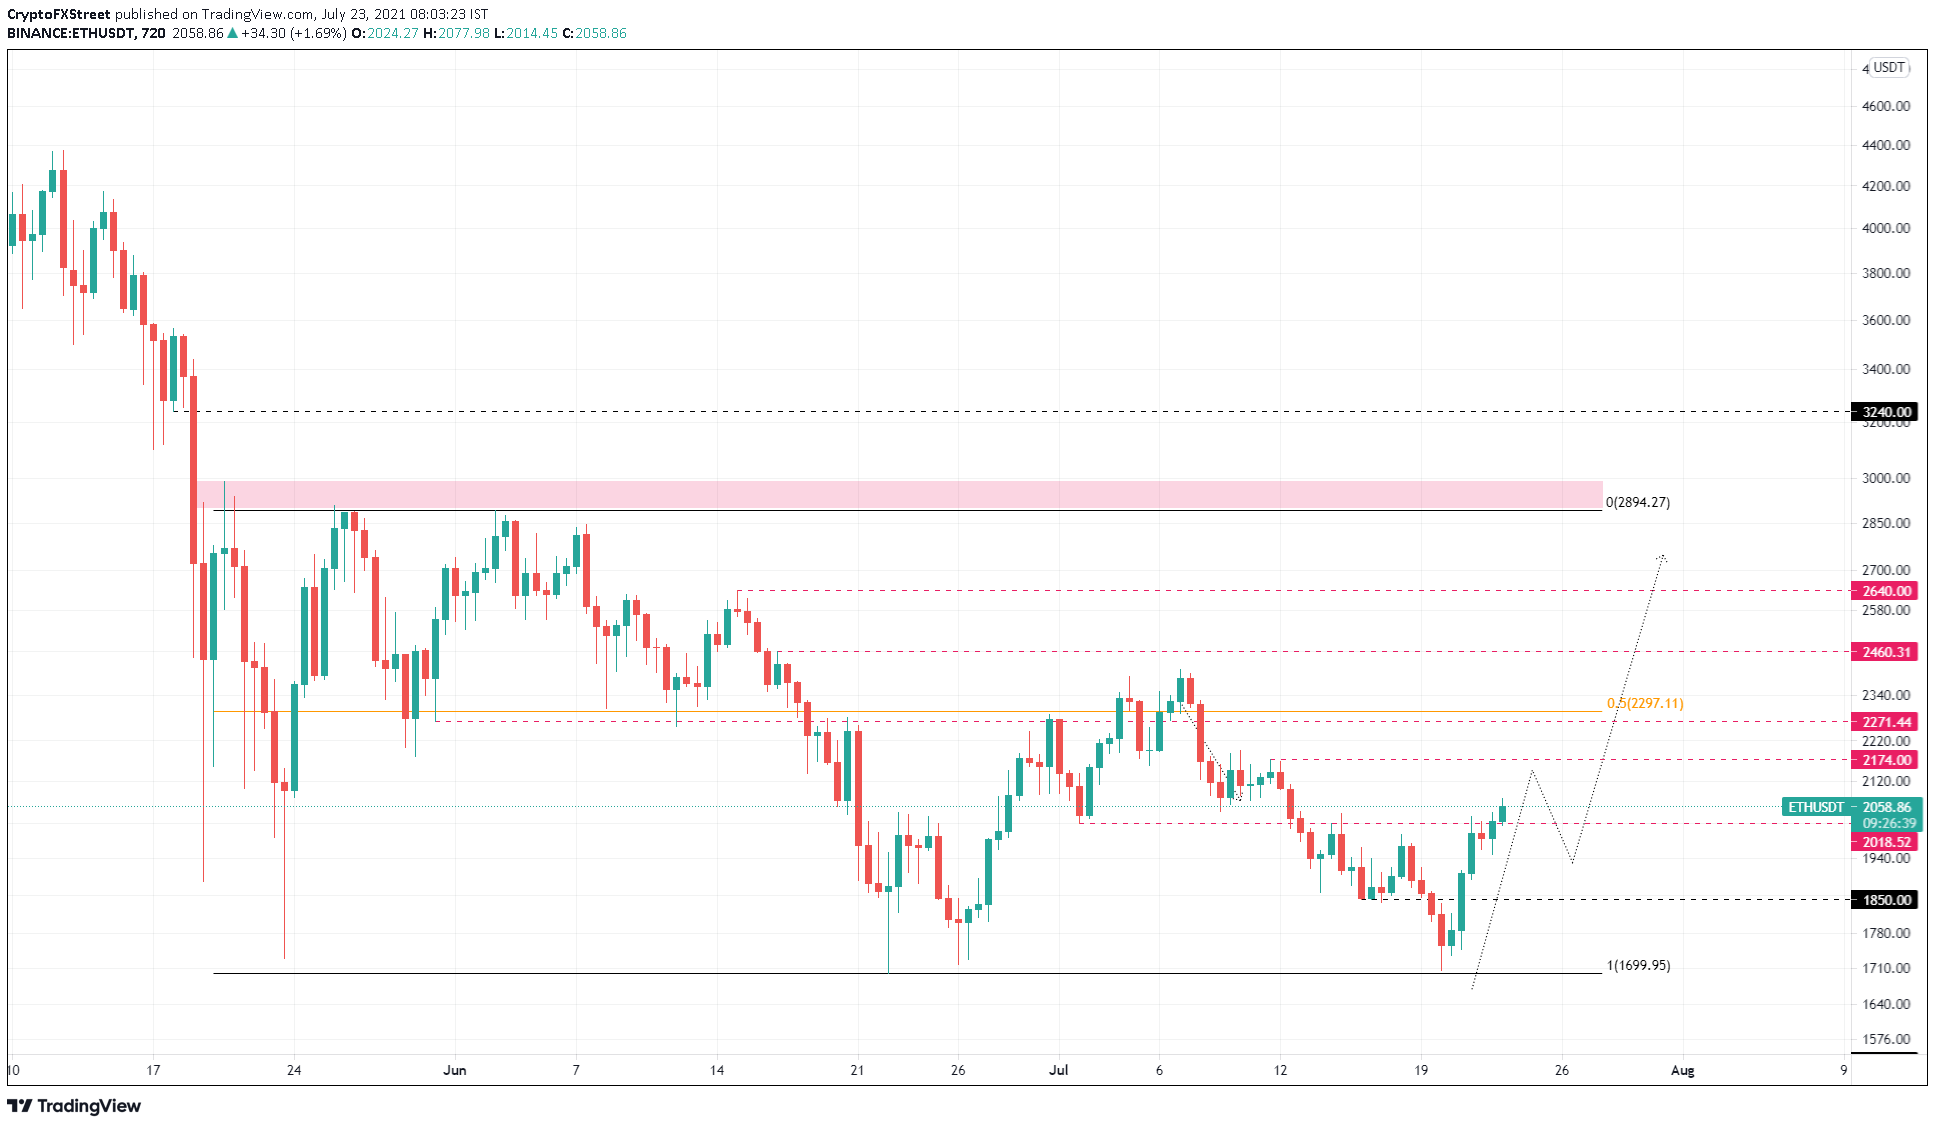
ETH/USDT 12-hour chart
Supporting this uptrend is the lack of resistance levels portrayed by the Global In/Out of the Money (GIOM) model. This on-chain indicator reveals that 3.5 million addresses previously purchased 10.49 million ETH ranging from $2,108 to $2,497. This underwater investor cluster is the only significant resistance level that might threaten the altcoin’s immediate upswing.
Therefore, market participants can expect Ethereum price to pierce this range and tag the $2,500 resistance level before facing selling pressure from the users who might try to break even.
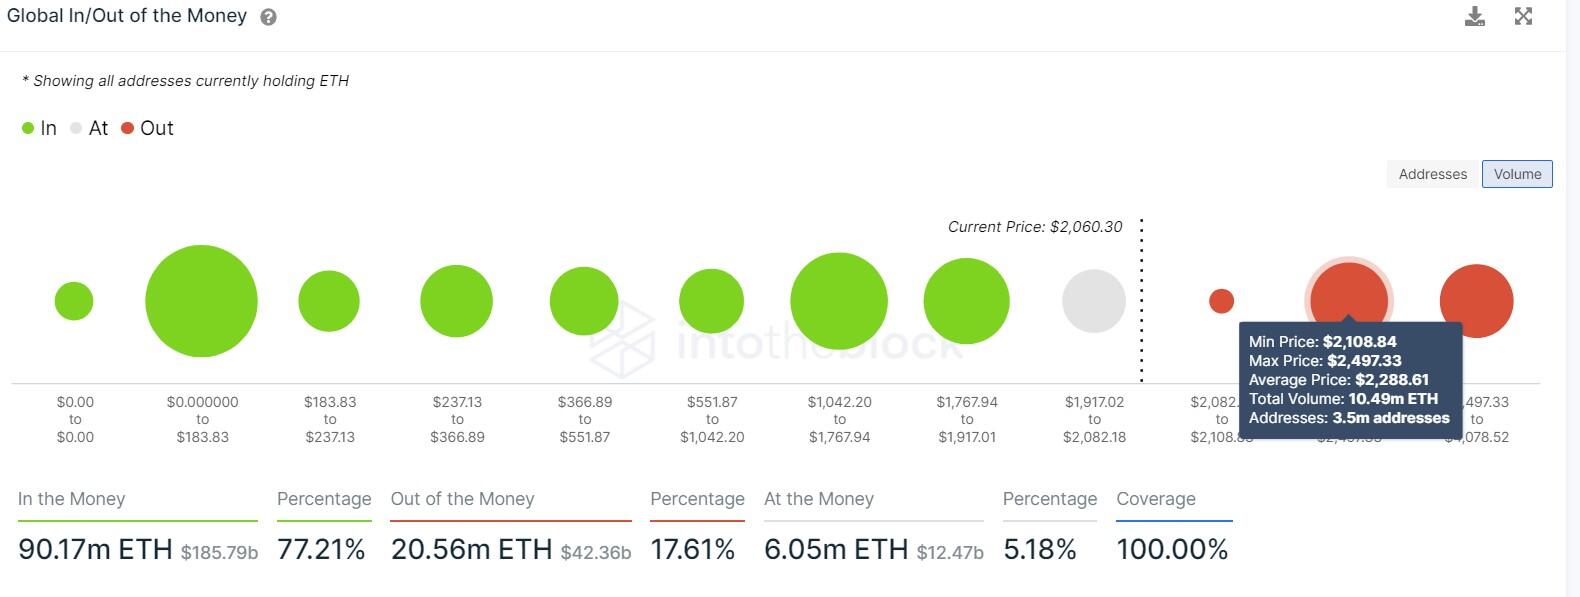
ETH GIOM chart
Further clarifying that there will not be any major downswings is the 30-day Market Value to Realized Value (MVRV) model, which recently pierced the zero-line. The MVRV is currently hovering around 1.21%, indicating that not a lot of investors are in profit.
This implies that there will not be a sudden or unexpected sell-off.
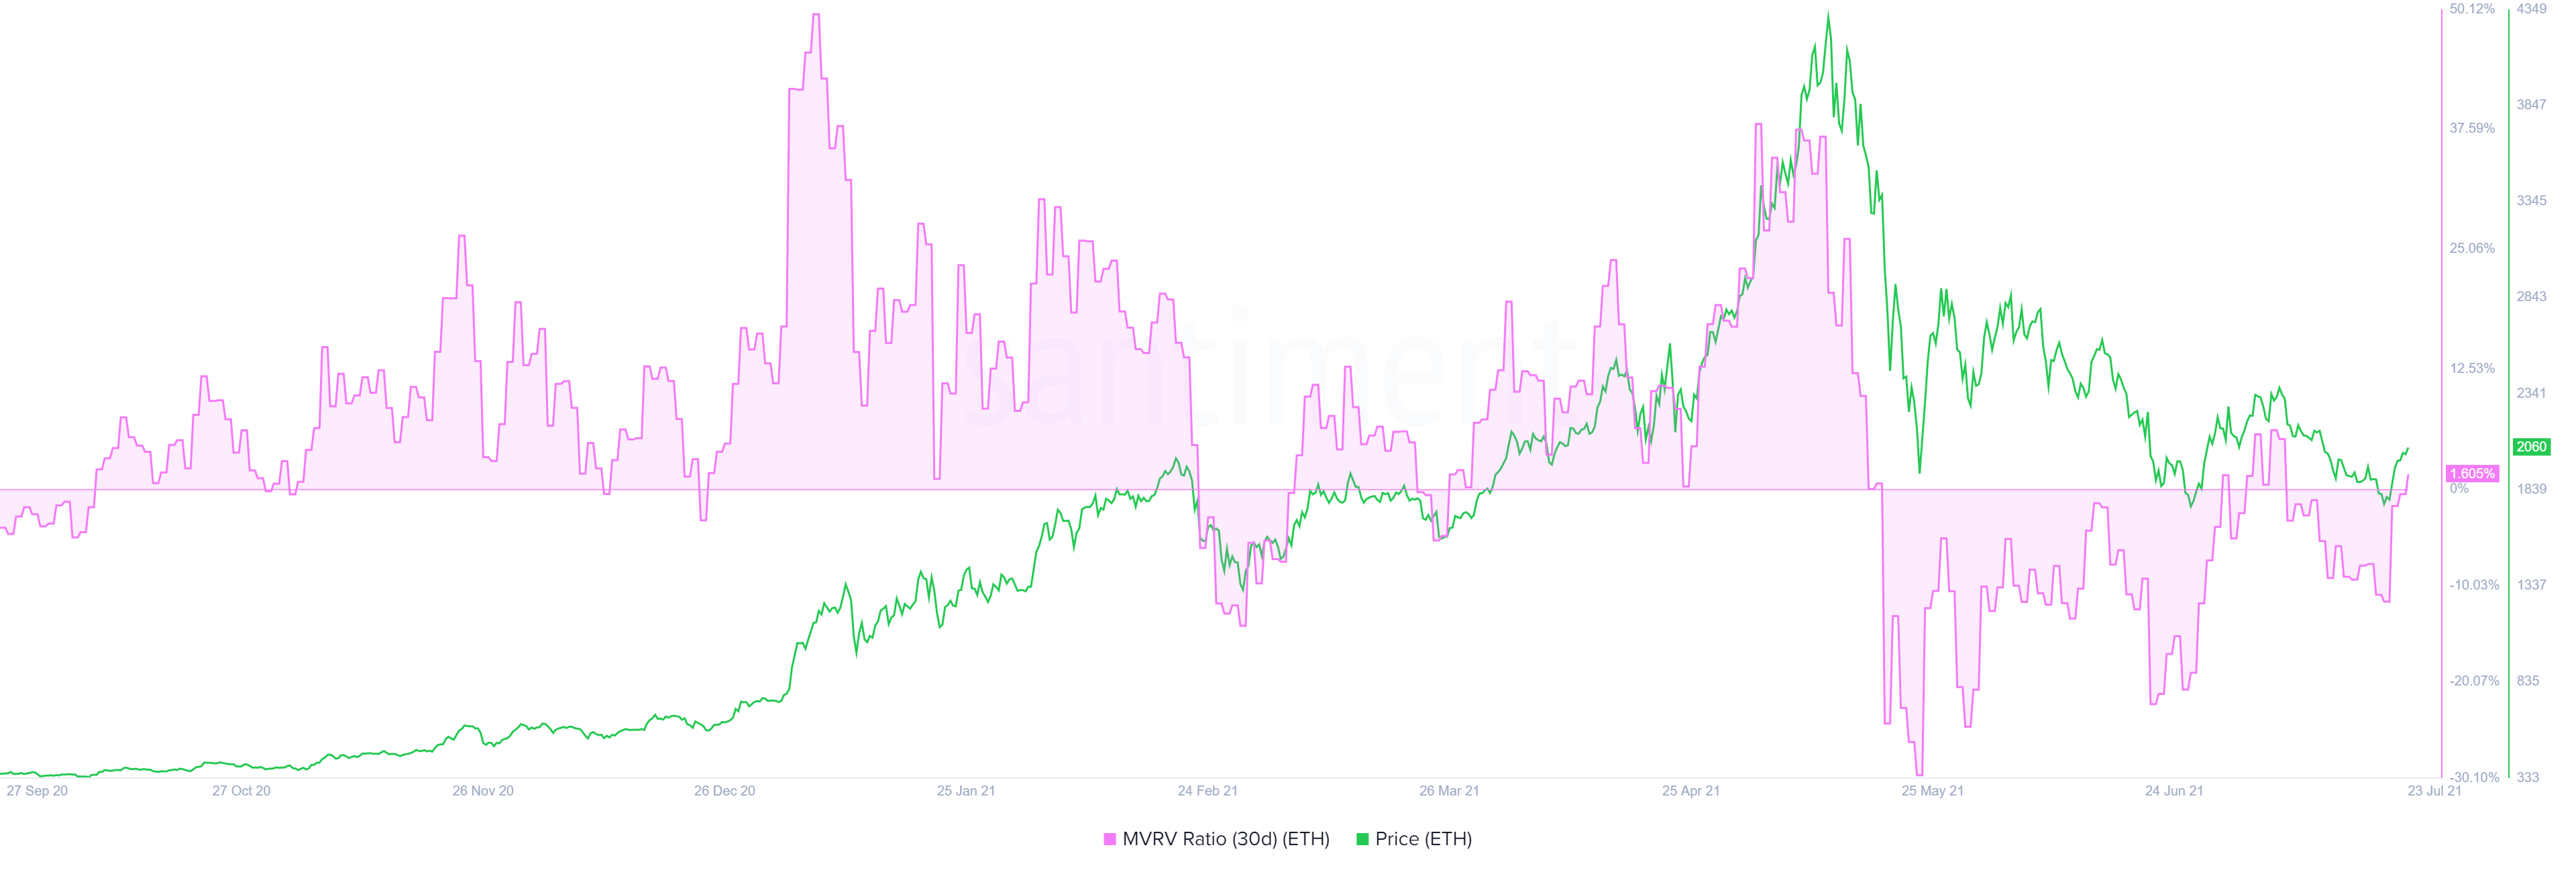
ETH 30-day MVRV chart
While things look good for the altcoin, market participants need to note that a minor retracement might be in the works before Ethereum price hits $2,500. The exchange inflow on-chain metric shows that roughly 546,000 ETH flowed into exchanges on July 22. This pullback could occur now or after sweeping the $2,174 resistance levels.
Although this inflow is relatively low, it could potentially disrupt the uptrend.
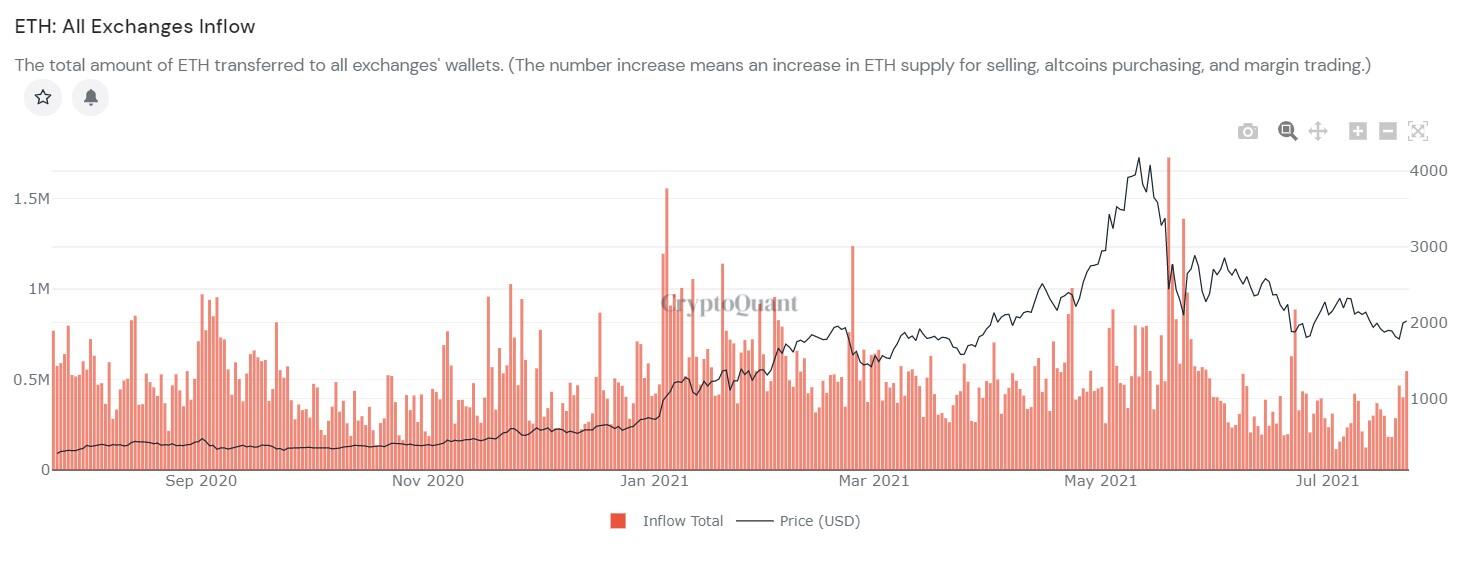
ETH all exchanges inflow chart
Things could go awry if this correction tags $1,850 and breaches it. Such a move would invalidate the bullish thesis and open the possibility of a 7% downswing that retests the range low at $1,706.


