
- EUR/GBP’s four-day recovery triggers a falling wedge breakout on the 1D chart.
- A rally towards the 200-DMA at 0.8767 cannot be ruled out in the medium term.
- RSI has turned lower but remains comfortably above the midline.
EUR/GBP has paused its four-day recovery rally above 0.8600, consolidating Monday’s upswing before the next push higher.
The cross sliced through the key moving averages on the daily chart on Monday, reaching the highest levels since June 10.
In doing so, the price closed the day above the falling trendline resistance at 0.8602, yielding a falling wedge breakout on the said time frame. The bearish 100-Daily Moving Average (DMA) coincides at that level.
The technical breakout calls for a test of the 200-DMA at 0.8767. Ahead of that the 0.8700 threshold could often stiff resistance to the bullish traders.
The 14-day Relative Strength Index (RSI) has turned lower but remains well above the midline, keeping the buyers hopeful.
EUR/GBP daily chart
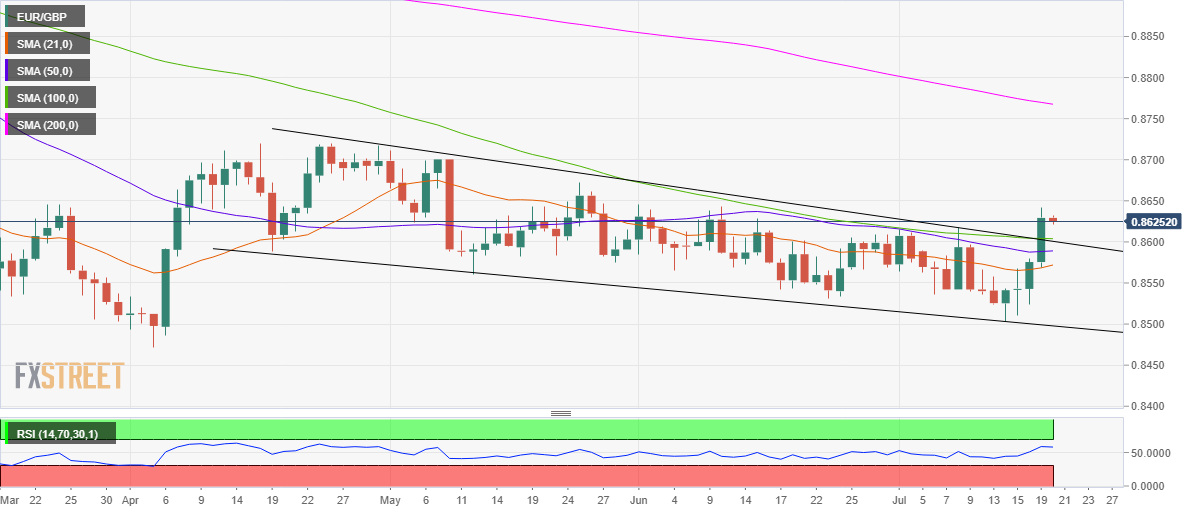
On the flip side, the confluence of the wedge resistance-turned-support and 100-DMA could limit immediate declines.
The next relevant cushion awaits at the bearish 50-DMA at 0.8590, below which the upward-pointing 21-DMA at 0.8571 could get tested.


