- EUR/GBP bears are waiting to pounce on BoE/ECB divergence.
- The US dollar would be in for some consolidation which leaves scope for a handsome correction in EUR/USD and cable.
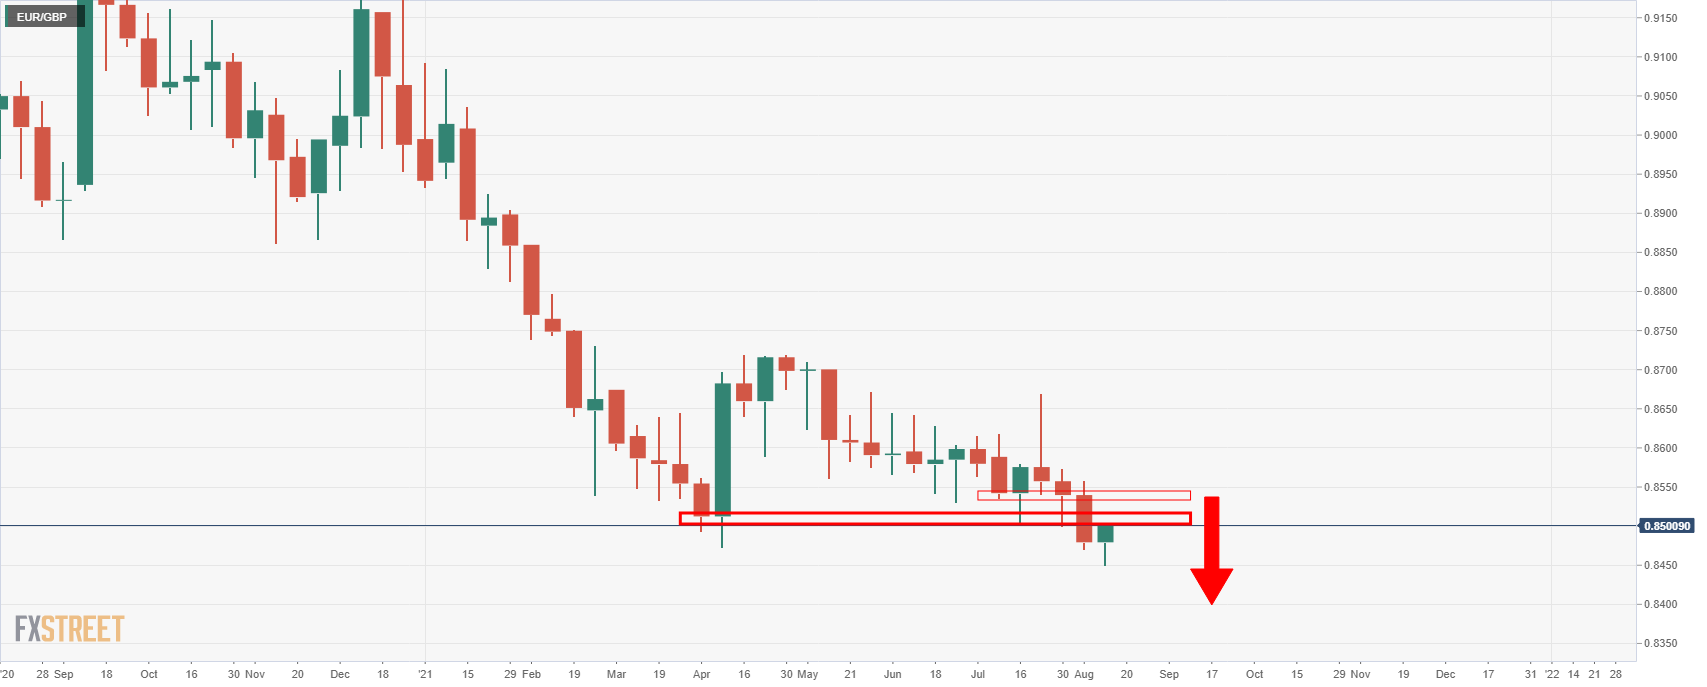
EUR/GBP is trading at 0.8501 and higher by 0.44% after climbing from a low of 0.8452 to a high of 0.8501.
Both cable and EUR/GBP ignored, for the most part, the second quarter Gross Domestic Product.
Instead, the pound was pressured by both the upstream US inflation data in Producer Prices as well as the potential dialling down of expectations from the Bank of England by market participants.
Official data has shown that Britain's economy grew in line with expectations in the second quarter.
The Office for National Statistics said the economy grew by 4.8% in the second quarter, in line with a Reuters poll of economists' quarter-on-quarter expectations.
Meanwhile, as investors continue to monitor the economic landscape and second guess the BoE's next move, a more interesting development is on the charts.
EUR/GBP technical analysis
The US dollar has been a driving force of late but it could be in for some consolidation until the next time the Federal Reserve will showcase its economic views and monetary policy plans.
These events are on 26-28 Aug Jackson Hole and then September 21-22, when there will be the official Federal Open Market Committee interest rate meeting.
Scanning the market, DXY struggles to get a foothold in the 93 area:
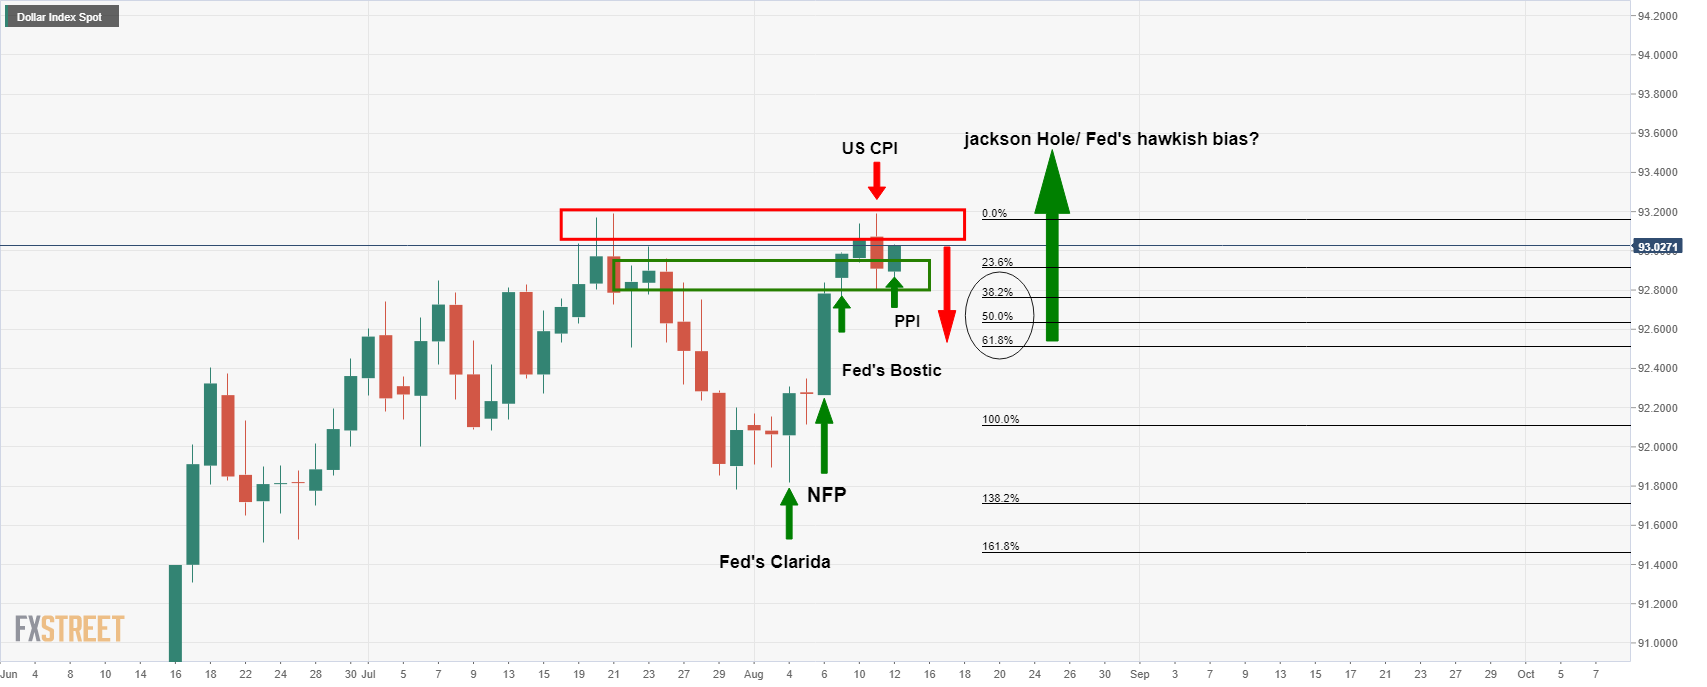
In the daily above chart, DXY has started to form an apex following a series of key events that drove the US dollar higher in the month of August on expectations of a taper from the Fed.
If the dollar starts to correct between now and the next Fed appearances, then this leaves scope for upside in both the pound and the euro.
EUR/USD has retested the low of March at 1.1700 where it has formed a Bullish Engulfing candlestick:
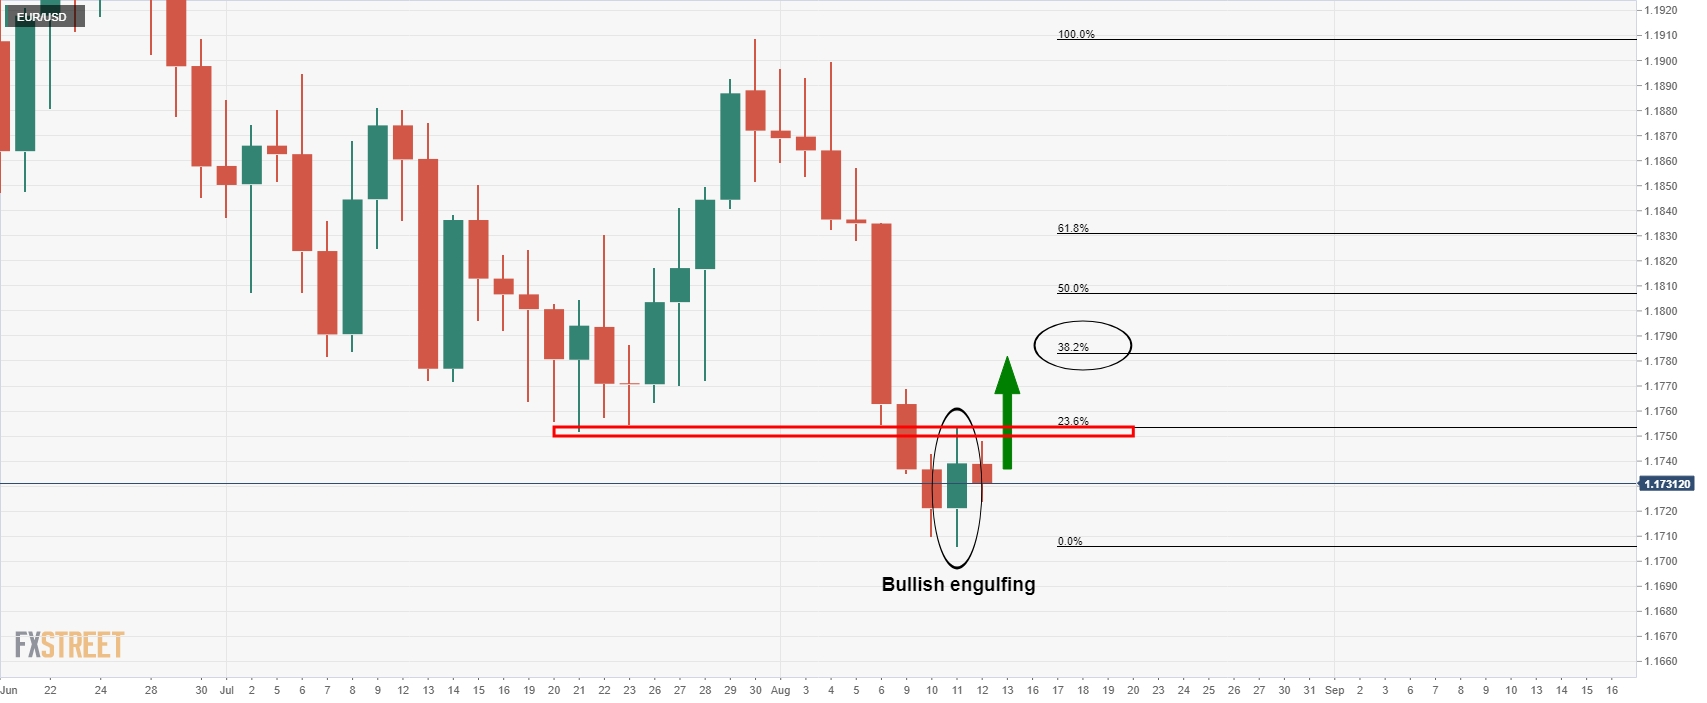
This is a bullish candlestick pattern that signifies a reversal in what is regarded as a sizeable bearish run that would usually be followed by a generous correction.
The strength in the candle has helped to support EUR/GBP on the day as cable falls to the lowest level since July 27.
EUR/USD bulls will target a break of the resistance and confluence of the 23.6% Fibonacci retracement for a deeper run towards the 38.2% Fibonacci.
However, when compared to GBP/USD's market structure and price action, EUR/GBP's upside is somewhat limited as it reaches up to test old weekly support.
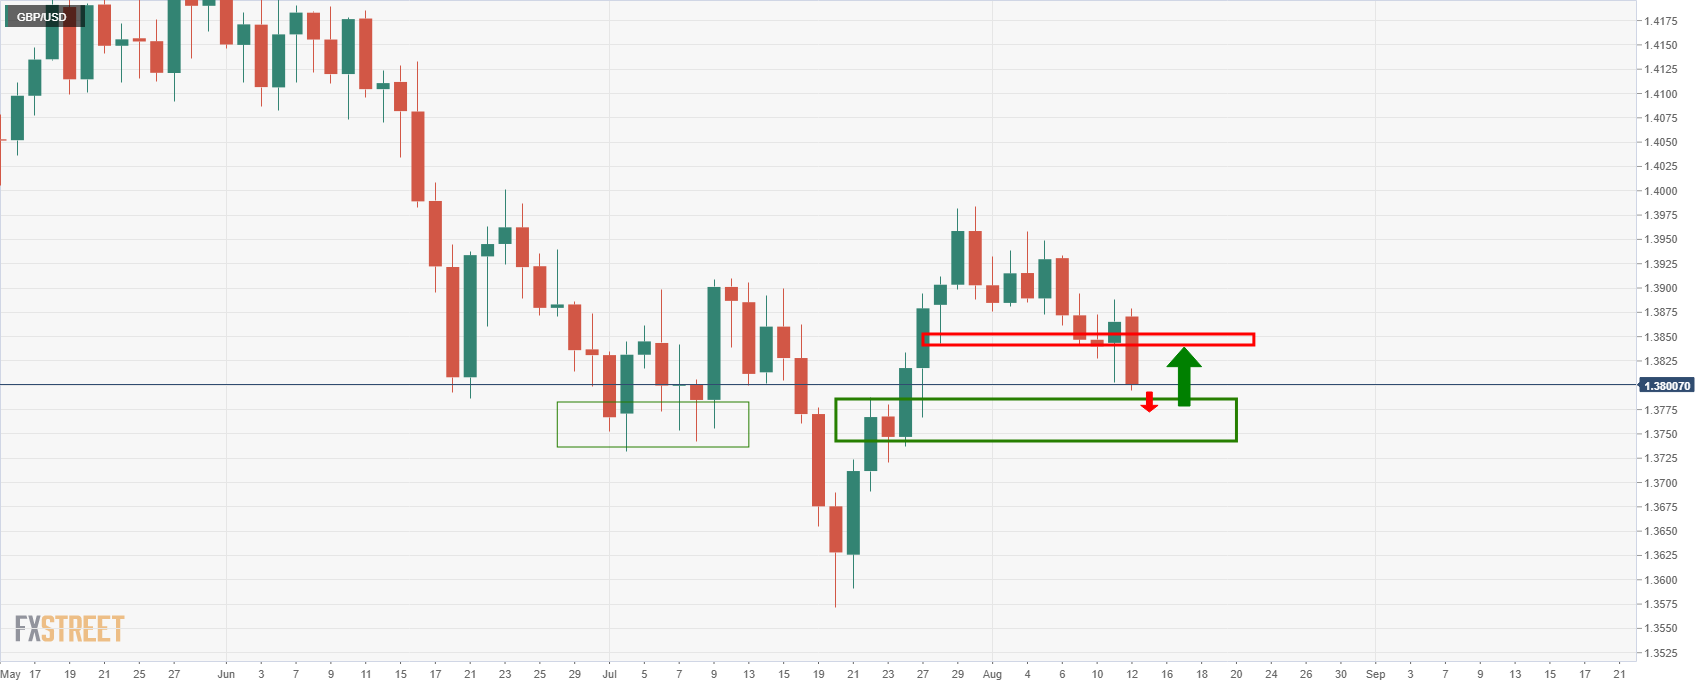
As illustrated above, GBP/USD is embarking on a test of critical support that would be expected to hold and see price rejected back towards daily resistance.
In such a scenario, EUR/GBP will have a hard time breaking the weekly resistance and staying above it.
Instead, EUR/GBP is more likely to find itself consolidating in current ranges until the next major market catalyst.
If the status quo prevails, hawkish Fed, strong dollar, BoE/ECB divergence, then the path of least resistance, both fundamentally and technically speaking, is to the downside for EUR/GBP.
EUR/GBP weekly chart