
- EUR/USD extends Friday’s upside break of 21-DMA to print four-day uptrend.
- Bullish MACD signals, RSI rebound favor short-term buyers inside bullish chart pattern.
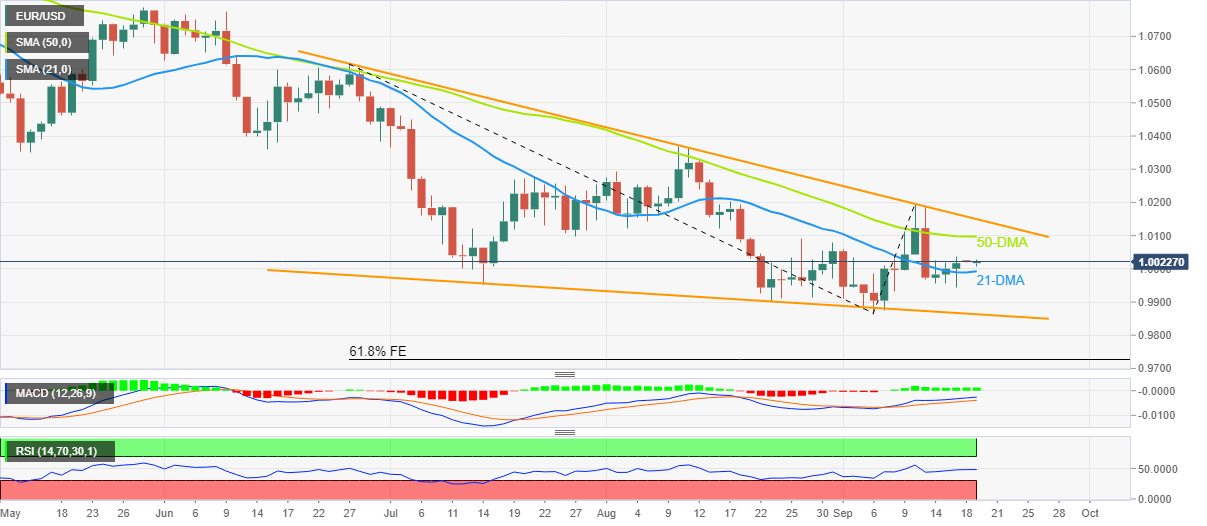
- 50-DMA guards immediate upside, 1.0150 is the key hurdle.
- Bears need validation from 0.9860 to retake control.
EUR/USD renews intraday high near 1.0030 during the four-day uptrend to Monday’s Asian session. The major currency pair’s latest run-up could be linked to Friday’s successful upside break of the 21-DMA, as well as the price-positive signals from the MACD and RSI.
That said, the quote is well-set to aim for the 50-DMA resistance near 1.0100. However, the upper line of a falling wedge bullish chart pattern, established in late June, around 1.0150, appears a strong upside hurdle.
It’s worth noting that a successful break of 1.0150 will confirm the bullish chart pattern suggesting a theoretical target surrounding 1.0900. However, tops marked during August and May, respectively around 1.0370 and 1.0790, could act as intermediate halts during the rise.
The monthly high around 1.0200 and June’s peak of 1.0615 are some extra upside hurdles that could entertain the EUR/USD bulls.
Alternatively, a downside break of the 21-DMA, near 0.9990 at the latest, could quickly direct the sellers towards the recent swing low close to 0.9945.
However, multiple levels surrounding 0.9880 and the lower line of the stated wedge, close to 0.9860, could challenge the EUR/USD bears afterward.
If the quote remains bearish past 0.9860, the odds of witnessing a slump towards the 61.8% Fibonacci Expansion (FE) of the pair’s late June to early September moves, near 0.9725 can’t be ruled out.
EUR/USD: Daily chart
Trend: Limited recovery expected


