
- EUR/USD posts small gains, bulls attempting the last dance?
- Daily technical setup shows a potential bear pennant.
- Focus on Friday’s close is critical to gauge the next direction.
EUR/USD is back in the green zone, reversing Thursday’s bearish momentum, as the US dollar remains on the back foot amid risk aversion-led weakness in the Treasury yields.
Despite the latest bounce, the spot remains below the key 1.1750 barrier, now trading at 1.1736, up 0.08% on the day.
From a near-term technical perspective, EUR/USD’s daily chart has taken the shape of a bear pennant formation, in the wake of the recent sell-off that followed a brief consolidative phase.
A daily closing below the rising trendline support at 1.1712 is needed to validate the bearish formation, which will confirm deeper losses in the coming days.
The 14-day Relative Strength Index (RSI) trades flat but remains below the midline, keeps floors open for further downside.
Confirmation of the bearish continuation pattern could expose the September lows at 1.1612.
EUR/USD: Daily chart
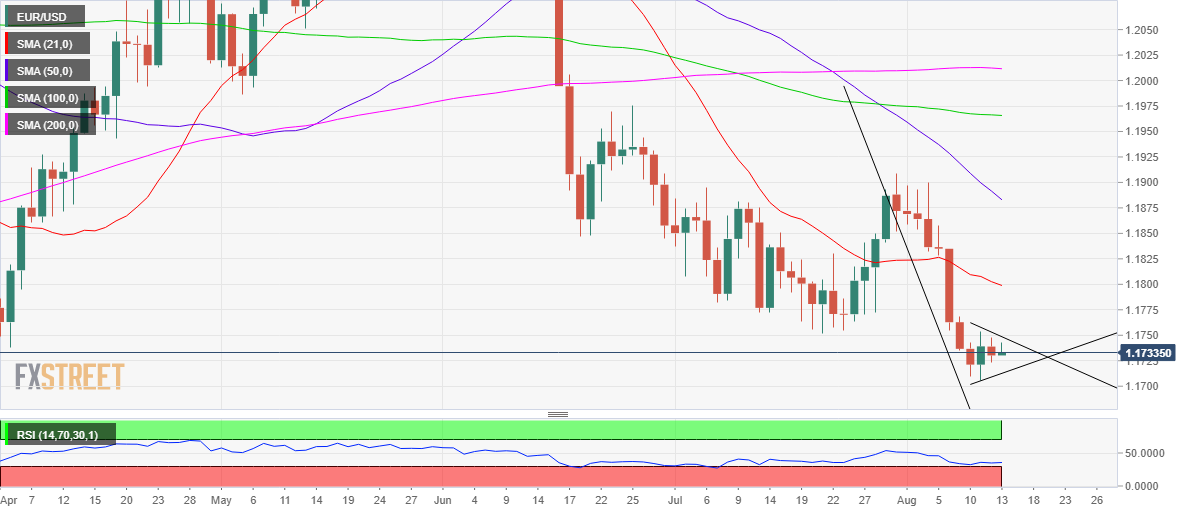
Alternatively, Wednesday’s high of 1.1754 offers immediate resistance to the euro buyers.
Acceptance above the latter would invalidate the potential bear pennant, calling for a test of the August 9 high of 1.1769.
Further up, a test of the bearish 21-Daily Moving Average (DMA) at 1.1798 cannot be ruled out.


