
- EUR/USD is fading the upside momentum despite weaker USD, Treasury yields.
- 200-SMA on the 4H chart at 1.1667 offers strong resistance to the EUR bulls.
- RSI ticks down but holds above 50.00, keeping downside limited.
EUR/USD has met fresh supply near the 1.1670 region, retracing towards 1.1650 ahead of the German IFO survey.
The pair ignores the broad-based US dollar weakness alongside the extended retreat in the Treasury yields, as the EUR bulls run into a key technical hurdle on the four-hour chart.
Its worth noting that the retracement could be also in the wake of the upcoming European Central Bank policy decision and US GDP report this week.
The rejection at higher levels is also backed by the latest downtick in the Relative Strength Index (RSI). However, the leading indicator still remains well above the midline, keeping the buyers hopeful.
A four-hourly candlestick closing above the 200-Simple Moving Average (SMA) at 1.1667 will revive the bullish momentum, opening doors towards the 1.1700 psychological level.
Further up, the next resistance zone is seen near the 1.1720 region.
EUR/USD: Four-hour chart
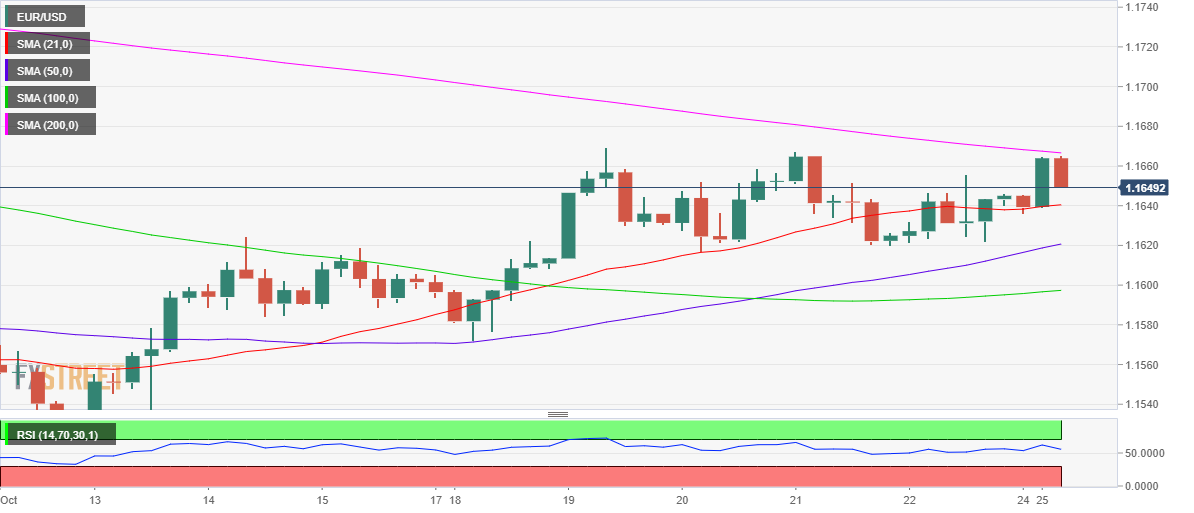
Meanwhile, if the latest pullback gathers steam, then a test of the mildly bullish 21-SMA at 1.1640 will be inevitable.
Bears will then aim for the upward-sloping 50-SMA at 1.1621.


