
- Cardano price is setting up a top reversal head-and-shoulders pattern on a daily time frame.
- A breakout from this technical formation might result in a 60% sell-off.
- On-chain metrics show that ADA bulls are hanging by a thread.
Due to the choppy nature of the cryptocurrency markets, most altcoins, including ADA, have taken a hit. Despite the sideways movement, some cryptocurrencies have managed to stay afloat. The same cannot be said for Cardano price, which is hovering around a dangerous territory that could make or break its short-to-midterm future.
Cardano price action reveals a red flag
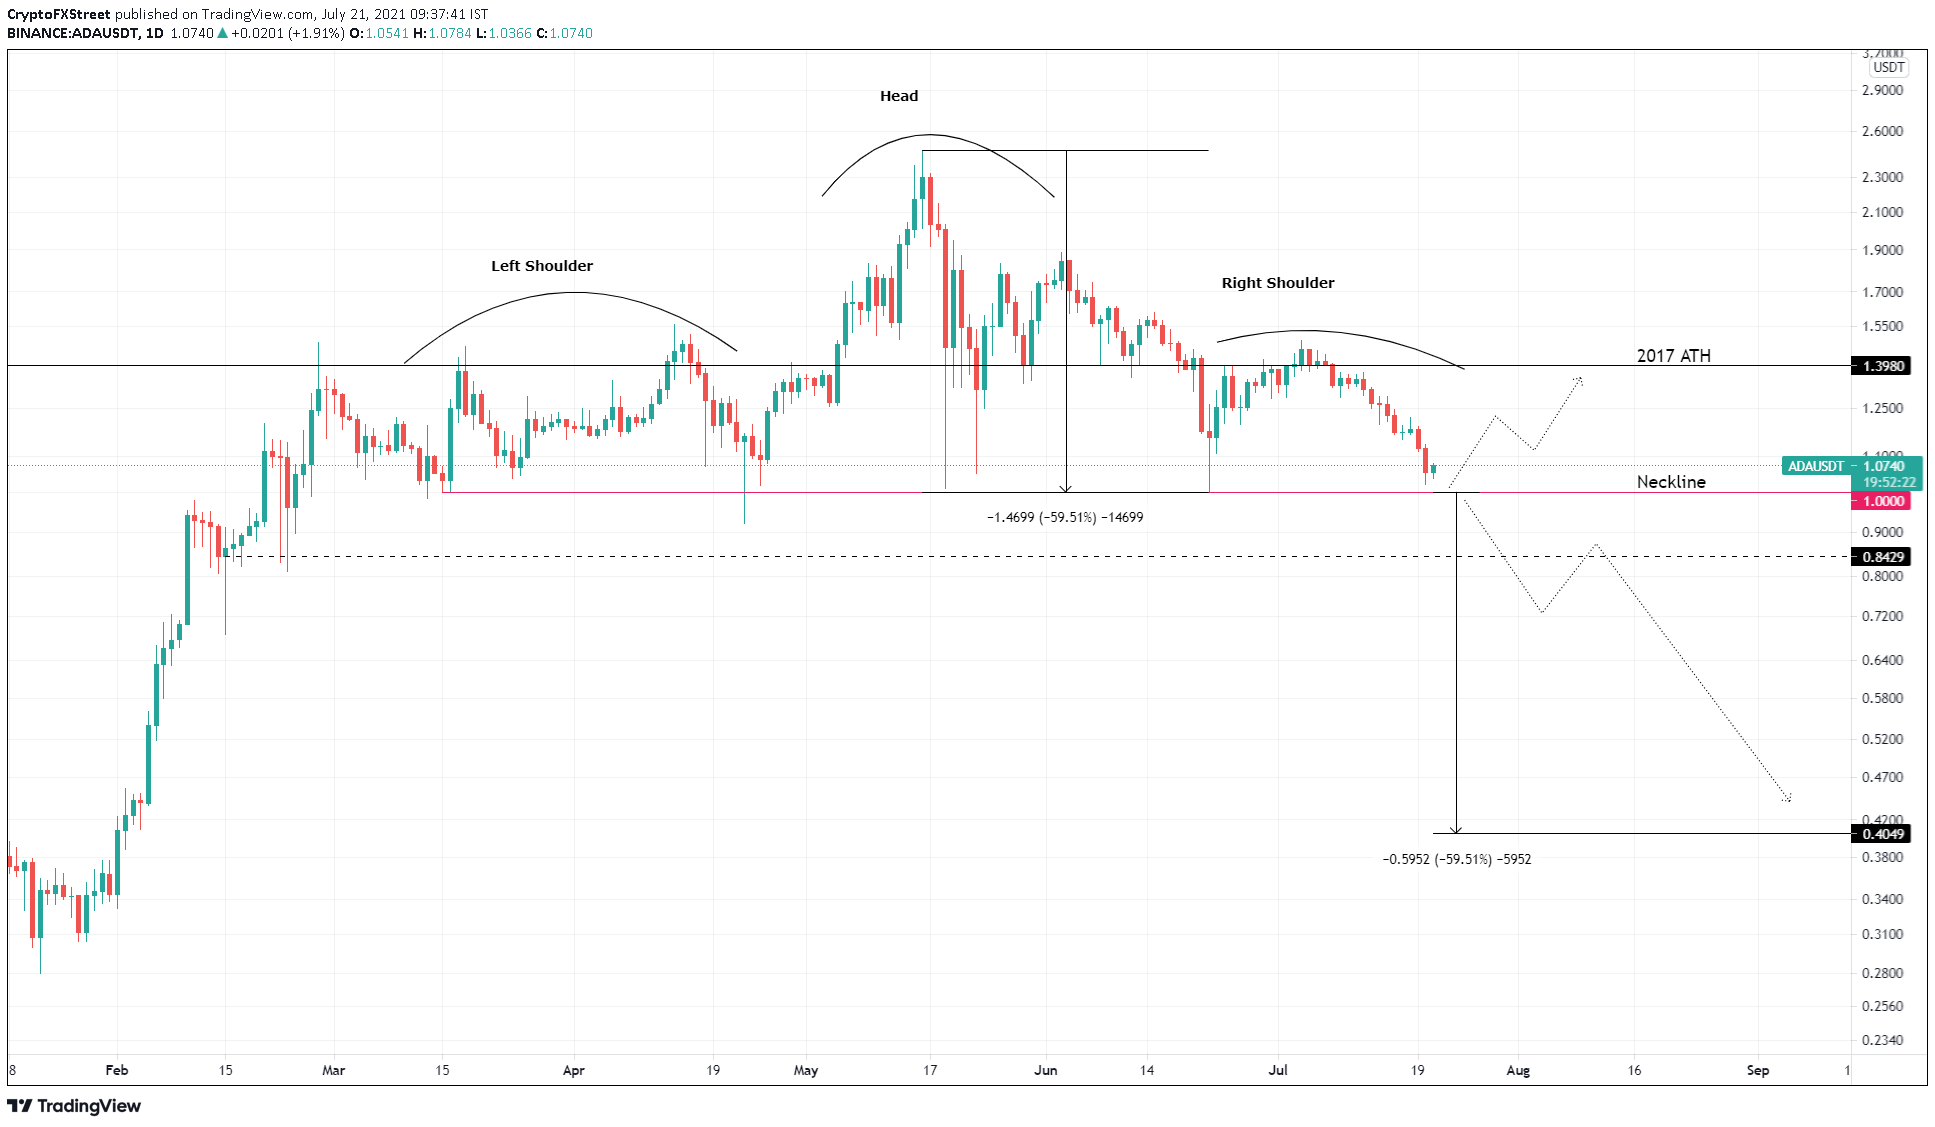
Cardano price action from March 15 to July 21 has formed a top reversal pattern known as head-and-shoulders. This setup contains three peaks, with the central one slightly taller than the rest, known as the “head.” The remaining swing highs on either side of comparable height form “shoulders.”
A trend line that connects the swing lows of all three peaks forms a “neckline,” a breach of which signifies a breakout.
This technical formation forecasts a 60% downswing to $0.409, obtained by measuring the distance between the head’s peak at $2.47 and the neckline at $1 and adding it to the breakout point.
Cardano price is currently close to testing the $1 psychological level. Therefore, a potential spike in selling pressure that pushes ADA below this barrier will likely trigger a massive downswing to $0.409. The $0.843 support level is vital and might be able to stop the bleeding.
If the buyers come to the rescue, there is a chance the so-called “Ethereum killer” might be able to reverse the trend and avoid the bearish descent.
However, a swift daily close below $0.843 will serve as a secondary confirmation of the downswing. Hence, investors need to keep a close eye on $1 and $0.843.
ADA/USDT 1-day chart
On-chain metrics indicate the grim nature of ADA holders
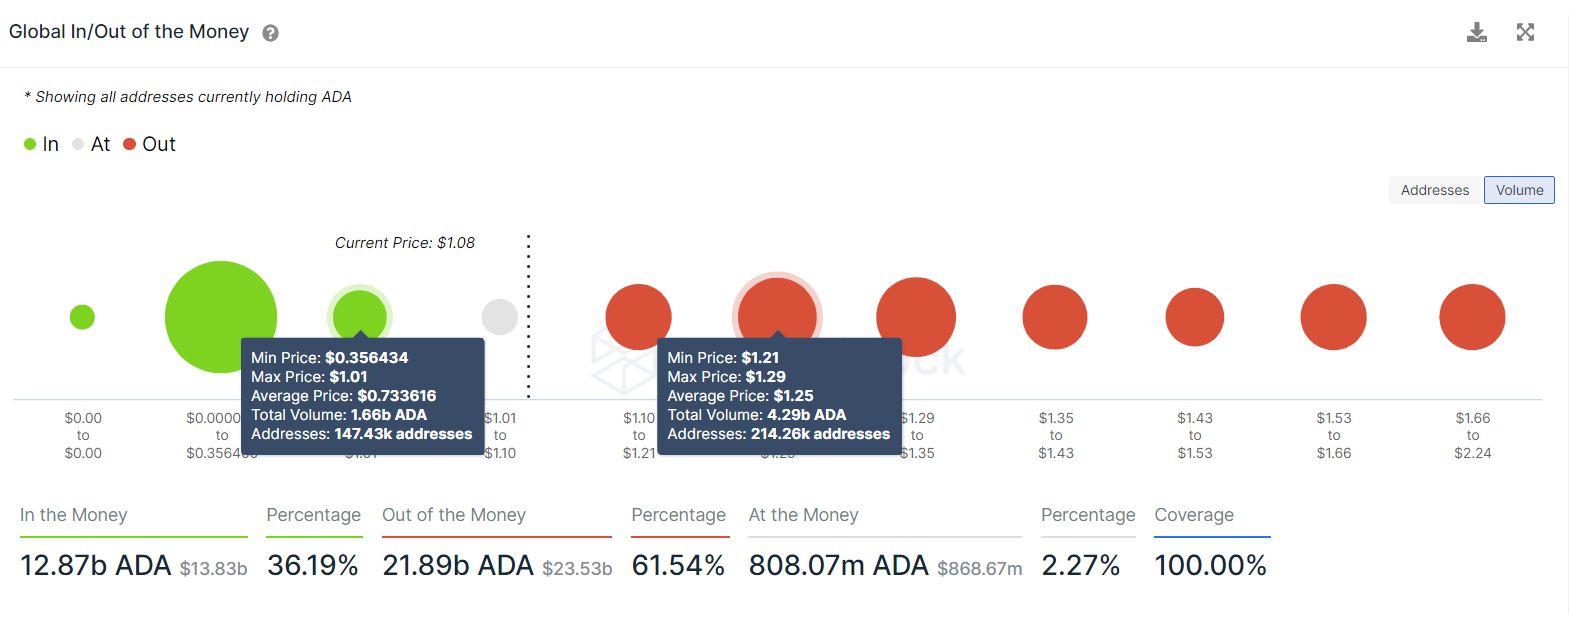
Supporting this bearish thesis is IntoTheBlock’s Global In/Out of the Money (GIOM) model, which shows a similar outlook, especially if the Cardano price slices below $1.07. Interestingly, the average buy-in price of these investors is eerily close to the neckline of the head-and-shoulders pattern, further enforcing the importance of this level.
Therefore, a move that shatters this barrier will put roughly 62,420 addresses that purchased 808.07 ADA at an average price of $1.07 underwater.
Panicking investors that sell to minimize their losses could further add to the selling pressure and exacerbate the down move.
Based on GIOM, the next immediate support level spans from $1.01 to $0.356. Here, 147,430 addresses that bought 1.66 billion ADA are present and will cushion the crash. Surprisingly, the bearish pattern’s target at $0.409 lies close to the lower limit of the support cluster mentioned above.
ADA GIOM chart
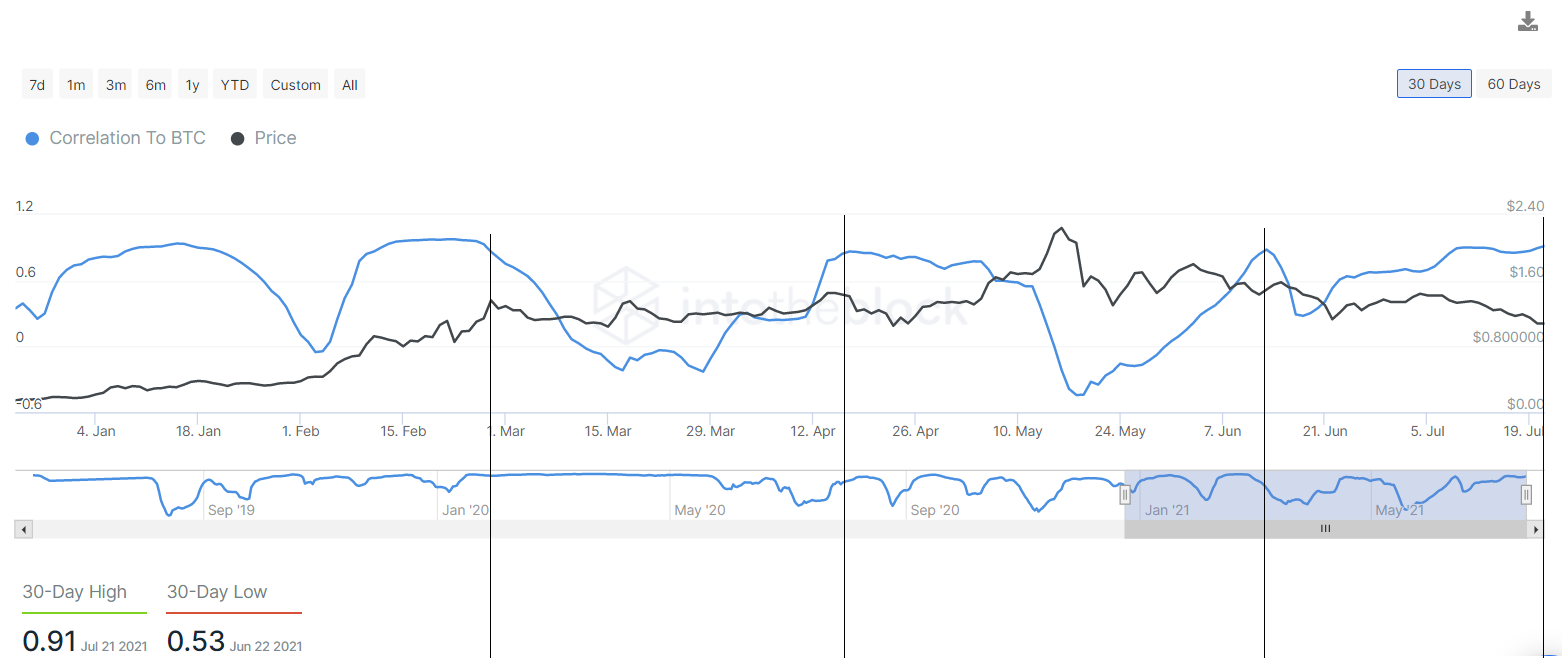
Cardano price was until recently in a league of its own and was termed the “rebel coin” since its moves were unaffected by the big crypto’s intraday volatility. However, of late, this precedent has changed, and the correlation of ADA with BTC has increased considerably.
Over the last four months, the 30-day correlation of Cardano with the big crypto has peaked thrice, and each time the ADA price has experienced a sell-off.
From February 26 to March 15, the correlation coefficient decreased from a peak of 0.86 to -0.22, resulting in a 23.3% decrease in the market value of ADA.
A similar event occurred from June 13 to June 22, which led to a 20% drop in Cardano price.
If this trend continues, the so-called “Ethereum killer” might likely experience another sell-off since the correlation coefficient is currently hovering around 0.91.
ADA-BTC correlation coefficient chart
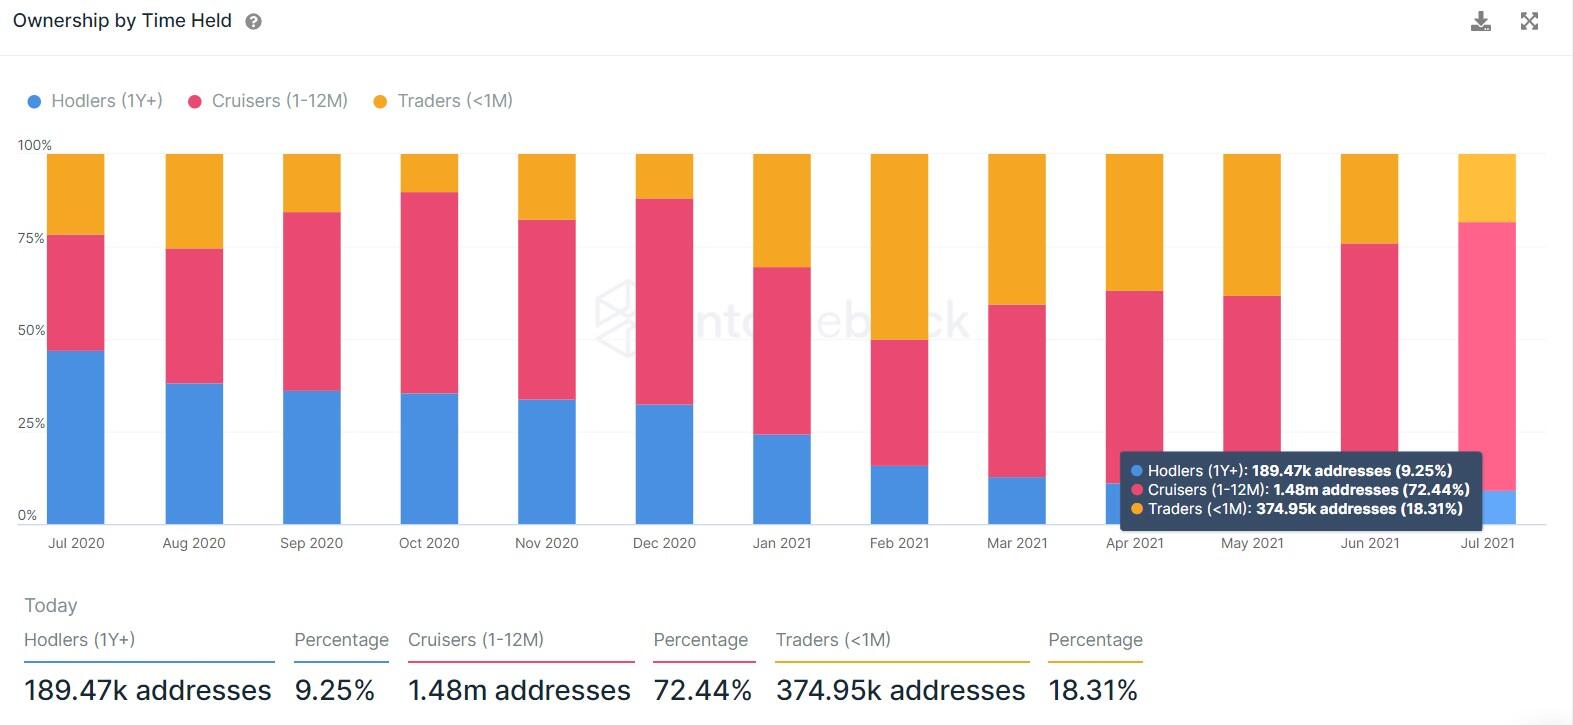
Lastly, the circulating ADA tokens have seen a paradigm shift in the type of investors holding them. For example, in July 2020, “hodlers,” market participants that typically hold ADA for more than a year, constituted 47% of the total 210,950 addresses.
“Cruisers,” holding tokens between one month and a year, amounted to 31.5% or 141,280 addresses. In contrast, the remaining 21.6% were “traders” who hold their investments for less than a month.
At the time of writing, long-term holders have reduced to 9.3%, while cruisers have increased to 72.4% and traders to 18.3%.
This dramatic redistribution suggests that strong hands are offloading their investments to weak hands, implying that a potential spike in selling pressure might trigger a panic sell-off from traders and cruisers.
While the ownership by time metric paints a good picture of token redistribution, readers need to take the interpretations with a grain of salt since it does not factor ADA that were moved to staking addresses.
ADA ownership by time held chart
These four reasons paint the bearish nature from both a technical and an on-chain perspective, suggesting that a Cardano price sell-off is just one small crash away.
Therefore, investors need to pay close attention to the neckline at $1 and the support level at $0.843.
While things seem awry for the so-called “Ethereum killer,” market participants should note that a sudden spike in buying pressure that pushes Bitcoin price into an upward trajectory could disregard the technical analysis and on-chain metrics, primarily due to the high correlation of ADA with the pioneer cryptocurrency.
An increasing bullish momentum that pushes ADA above the 2017 all-time high at $1.398 will invalidate the bearish thesis. However, market participants should wait for a secondary confirmation that will arrive after the buyers push Cardano price to produce a higher high above the right shoulder’s peak at $1.495.


