
- GBP/USD is in the hands of the bears testing the 1.1650s.
- From an hourly perspective, GBP/USD is decelerating into a 38.2% Fibonacci retracement level.
GBP/USD is down some 0.45% on the day so far while risk assets see some recovery following the bumpy ride into Jackson Hole Meeting. The pound climbed to 1.1760 from 1.1621 on Tuesday in what was a US dollar move across the board. The greenback has sunk as per DXY from the session highs of 109.111 and now idles at 108.80, up slightly on the day after rising from a low of 108.286.
The US dollar is softer despite world stocks retreating again on Tuesday amid concerns about the chance of more interest rate hikes in Europe and the United States. Data this week so far has kept the hawkish sentiment going while economic growth and inflation readings have remained firm on either side of the pond despite the policy tightening so far. US data showed on Tuesday that job openings increased in July, underpinning the case for the Federal Reserve to stick to its aggressive monetary policy tightening path. In other data, August’s US CB Consumer Confidence rose to 103.2, topping expectations of 98. At the same time, the US Department of Labor reported that job openings on the JOLTs Openings report rose by 11.2 million, exceeding all the forecasts, while quits diminished.
We have also heard from Fed speakers on Tuesday. New York Fed President John Williams told Wall the Wall Street Journal that inflation expectations in the US were well anchored but added that it would take a few years to bring inflation back to 2%. Richmond Federal Reserve Bank President Thomas Barkin said on Tuesday that the United States is facing "post-war-like" inflation.
There were no UK data scheduled for release on Tuesday, but the focus is on the Bank of England which is expected to raise interest rates by another 50 basis points at its Sept. 15 meeting.
GBP/USD technical analysis
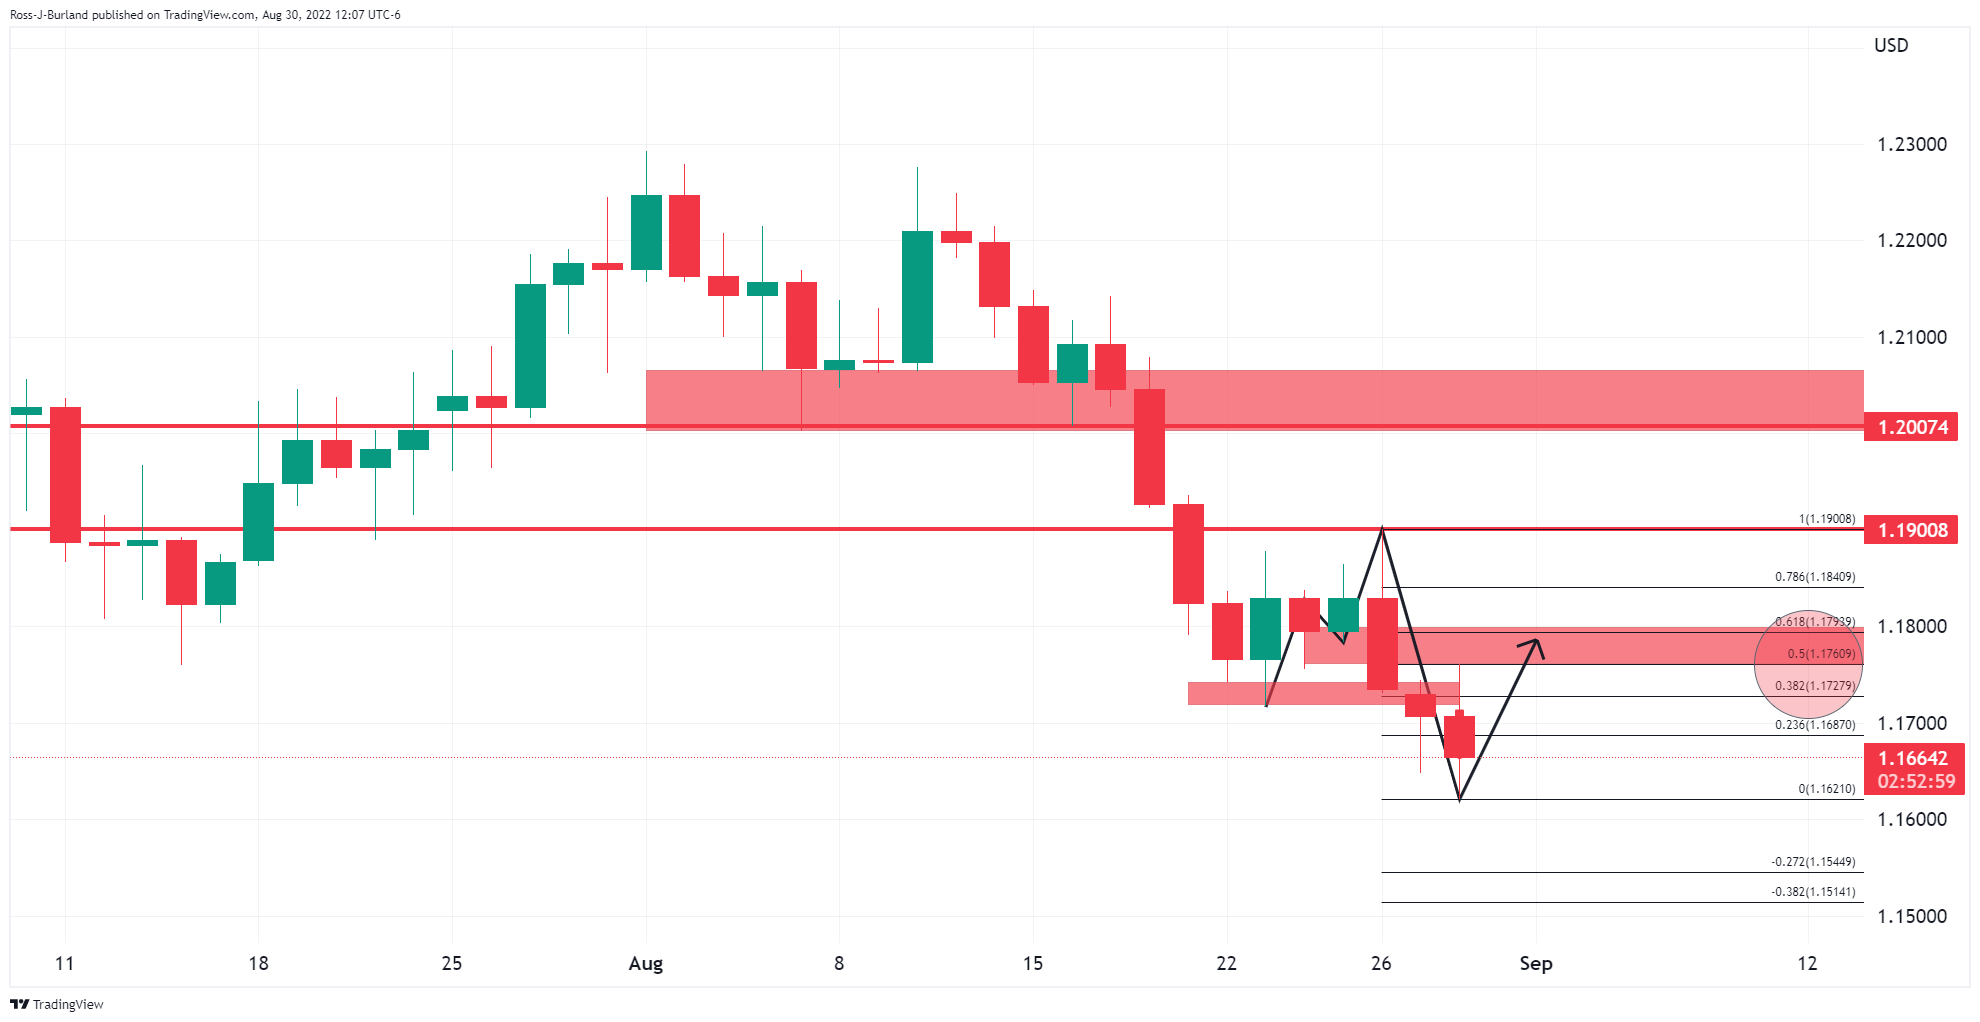
GBP/USD has continued to bleed out but the M-formation being left behind on the daily chart is a reversion pattern that would be expected to see the price retrace at least to a 38.2% Fibonacci retracement in due course.
GBP/USD H1 chart
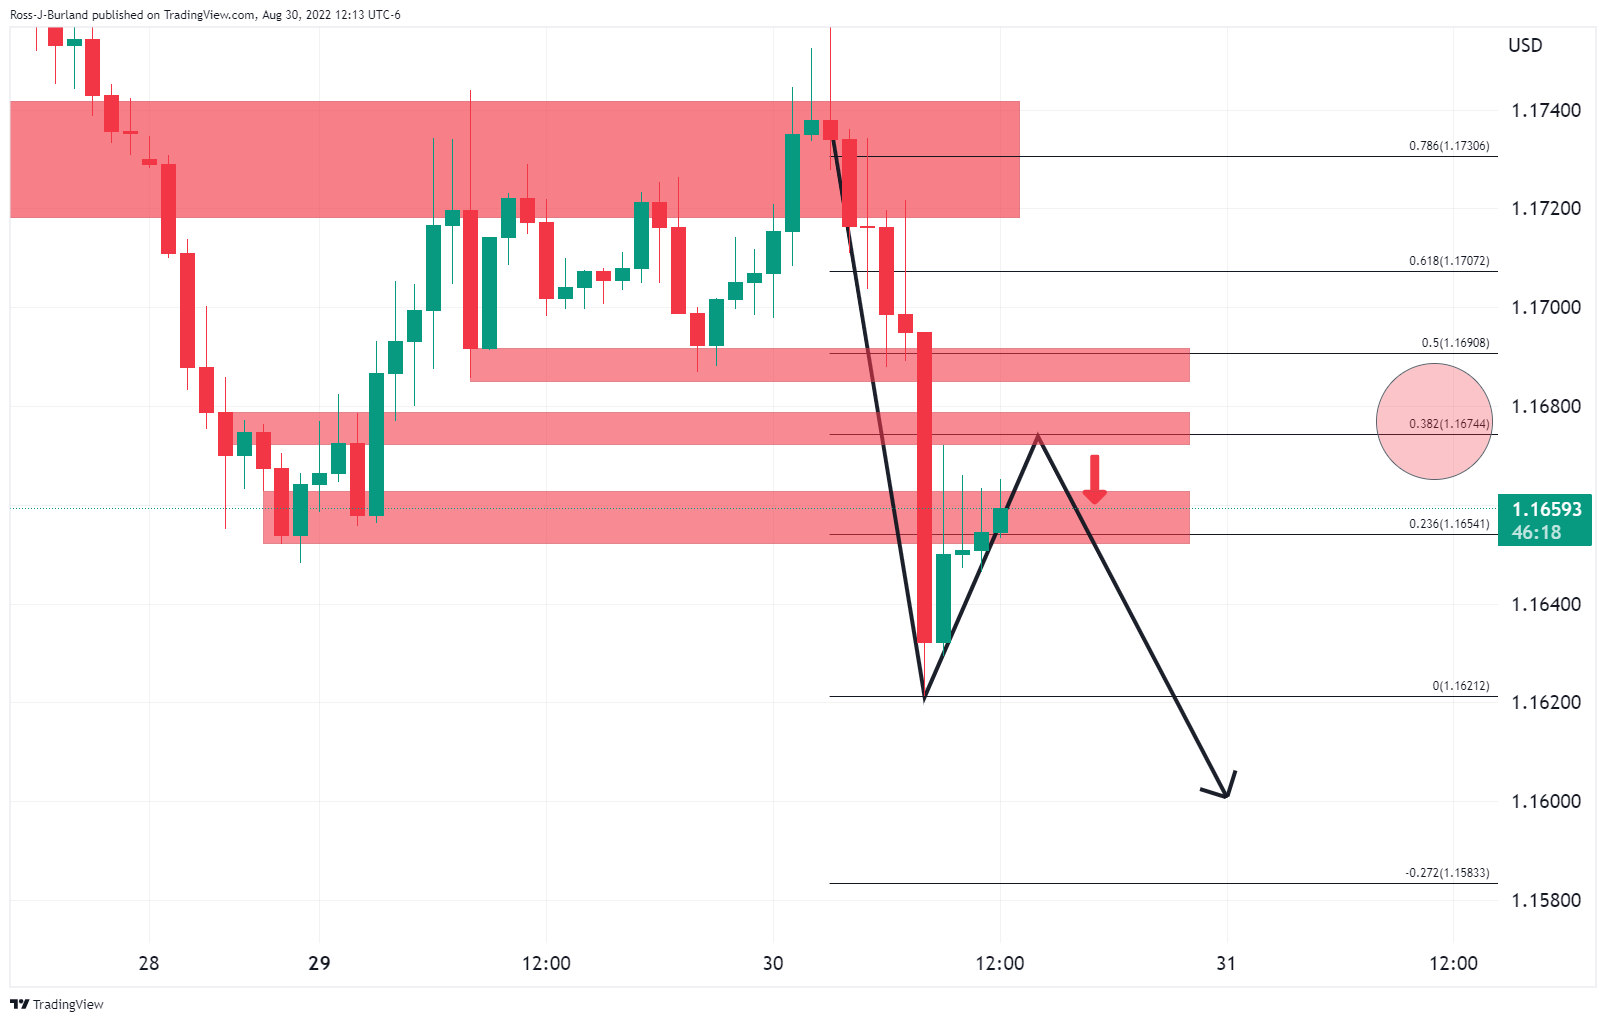
From an hourly perspective, the price has extended in a bearish impulse and the correction is decelerating into a 38.2% Fibonacci retracement level that could see the price revert to the downside again.


