
- GBP/USD keeps 10-DMA, short-term trend line breakout, grinds higher of late.
- MACD conditions also favor bulls aiming late September swing high.
GBP/USD hovers around 1.3615-20 during Friday’s Asian session, following the heaviest daily run-up in three.
In doing so, the cable pair cheers sustained break of the 10-DMA and previous resistance line from September 14. However, 38.2% Fibonacci retracement (Fibo.) of July-September fall guards immediate upside.
Given the MACD line’s bullish cross, the quote may overcome the 1.3630 nearby hurdle and can aim for the September 23 top of 1.3750.
It’s worth noting that 50% and 61.8% Fibo. levels, near 1.3700 and 1.3765 in that order, offer extra hurdles to the north.
Meanwhile, pullback moves may aim for 10-DMA and the resistance-turned-support, around 1.3570 and 1.3555 order-wise.
The 23.6% Fibonacci retracement level of 1.3545 and September-end high near 1.3515 will also question GBP/USD bears before directing them to the yearly low surrounding 1.3410.
GBP/USD: Daily chart
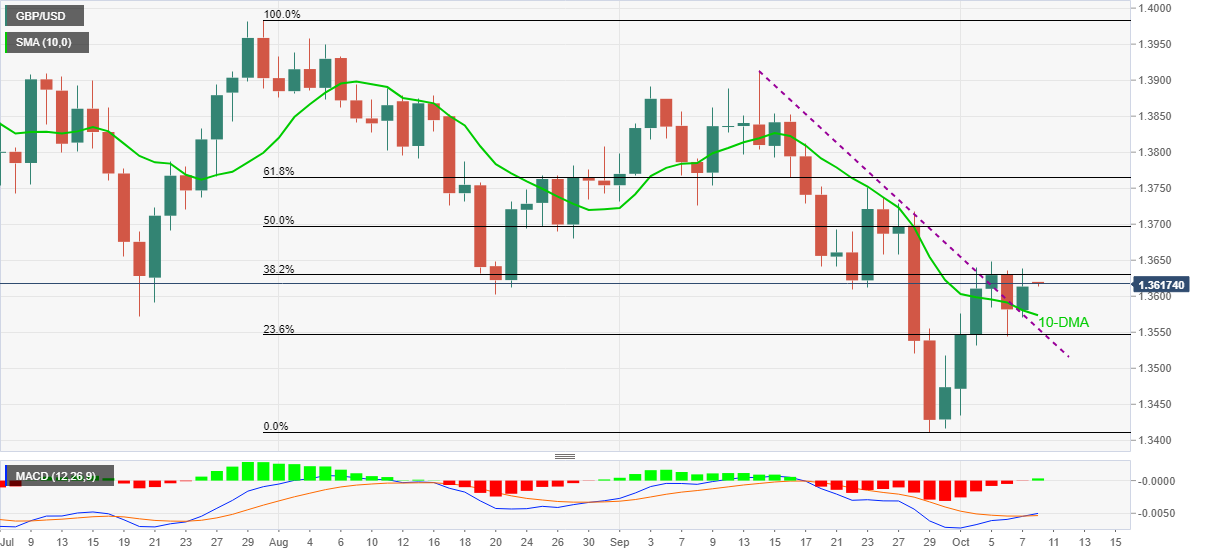
Trend: Further recovery expected


