
- GBP/USD stablises at a key 1.3750 area as traders move to the sidelines.
- The bulls are eyeing a run back towards the counter trendline from a daily perspective.
As per the prior technical analysis in this article, and a study of the Wyckoff Method, it was noted that cable was in a reaccumulation phase in the mark-down stage of the process.
Here is the chart that illustrated the downside potential for a scalp to the -272% Fibonacci retracement of the prior 38.2% Fibonacci retracement and correction:
Prior GBP/USD technical analysis
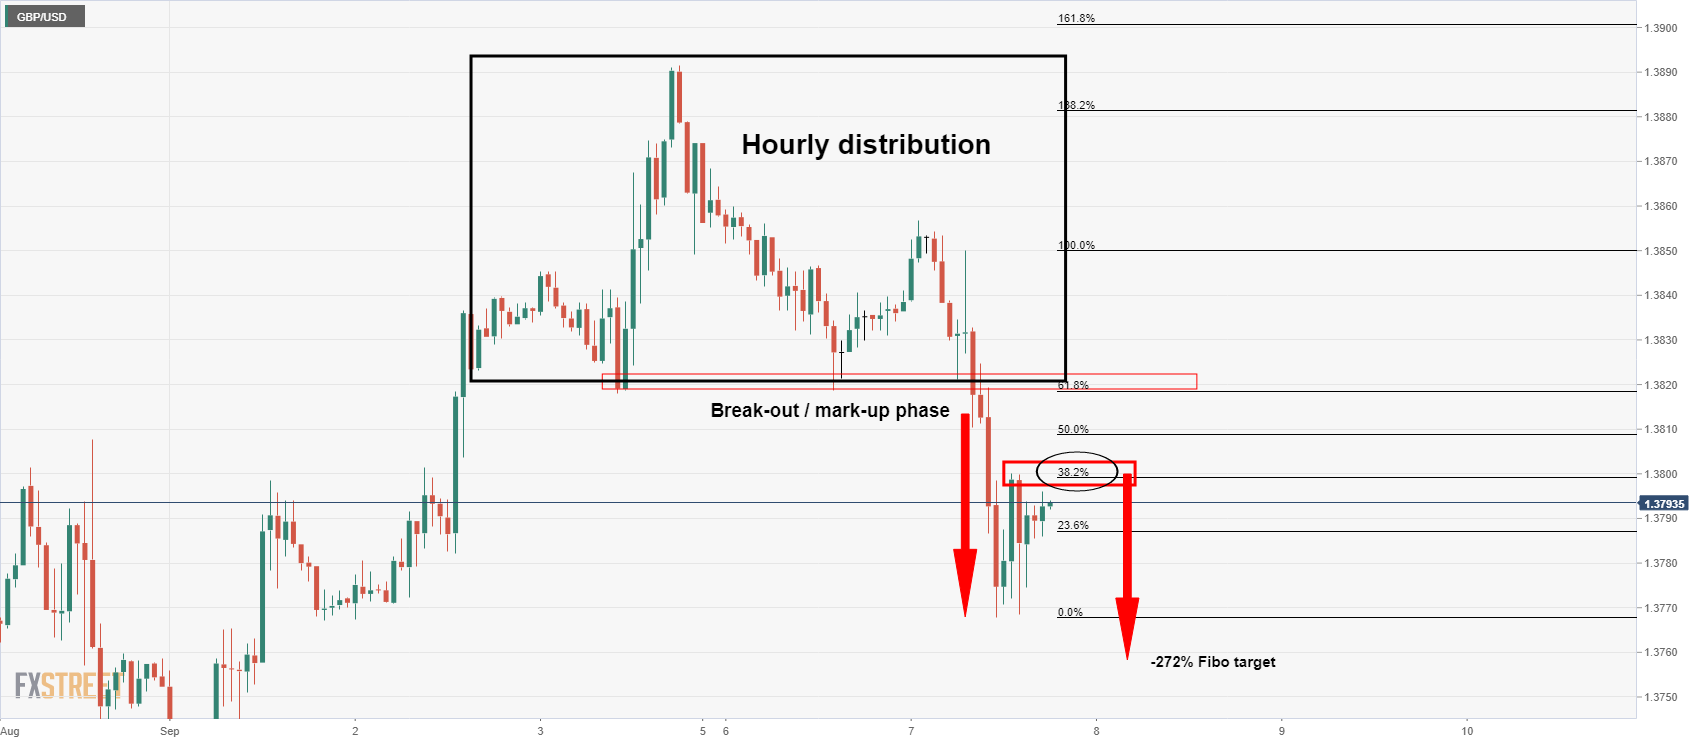
It was stated, ''as per the Wyckoff Method, the price has broken out of the distribution phase and below the head and shoulder's neckline, falling into the mark-down territory from which bears capitalised upon during London hours.
The price has since made a 38.2% Fibonacci retracement and would be expected to continue the southerly trajectory to at least a -272% Fibonacci retracement of the current correction's range to test 1.3750 territories.''
Live market update
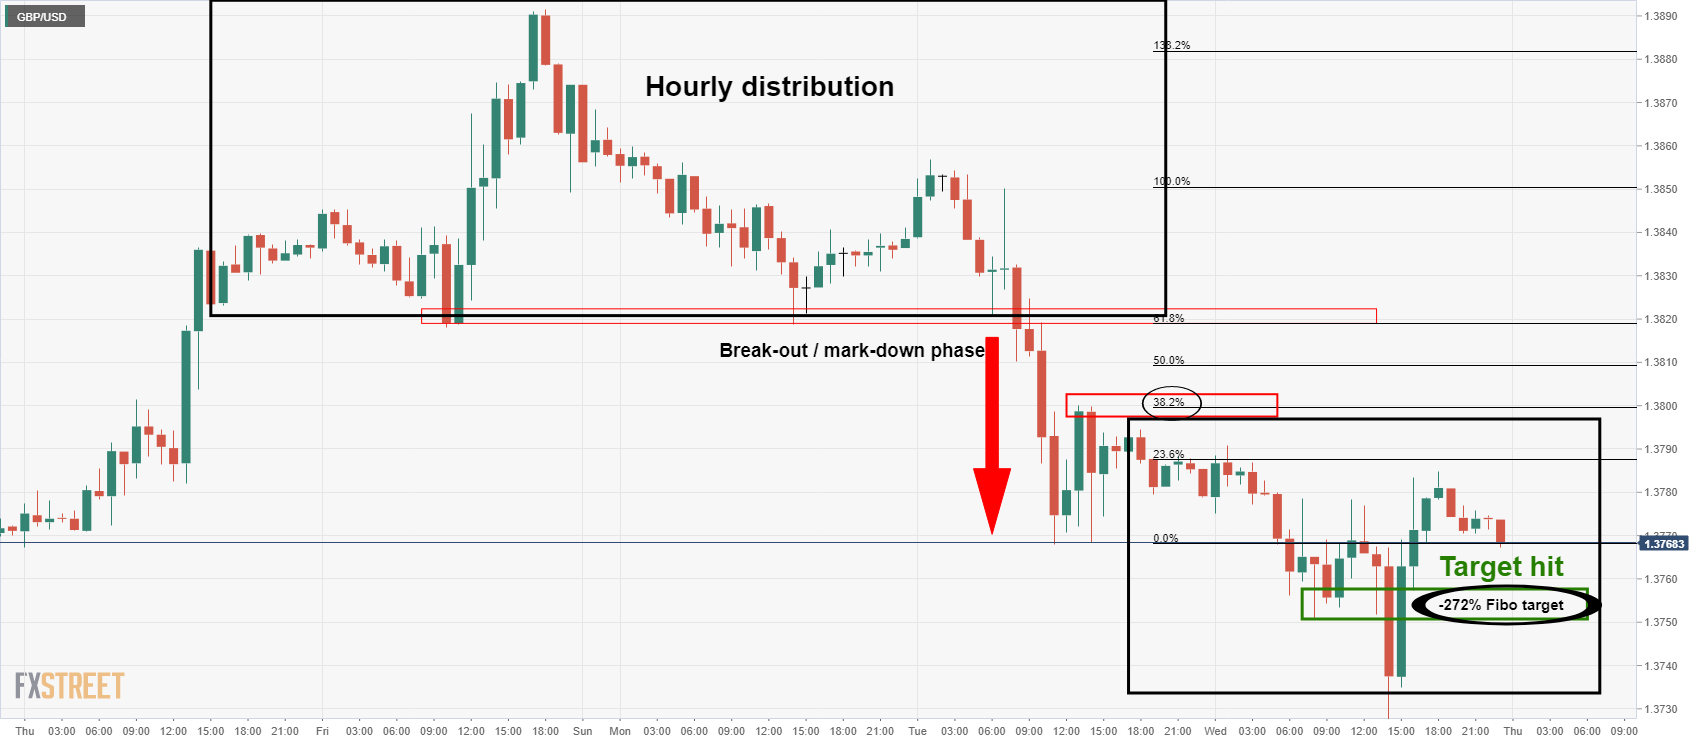
The 1.3750 target was hit in a decisive decline subsequent to the analysis.
Meanwhile, the price has made a firm rejection from the lows and offer little in the way of bias at the moment.
Traders will likely stay on the sidelines until critical structures are broken on a longer-term basis.
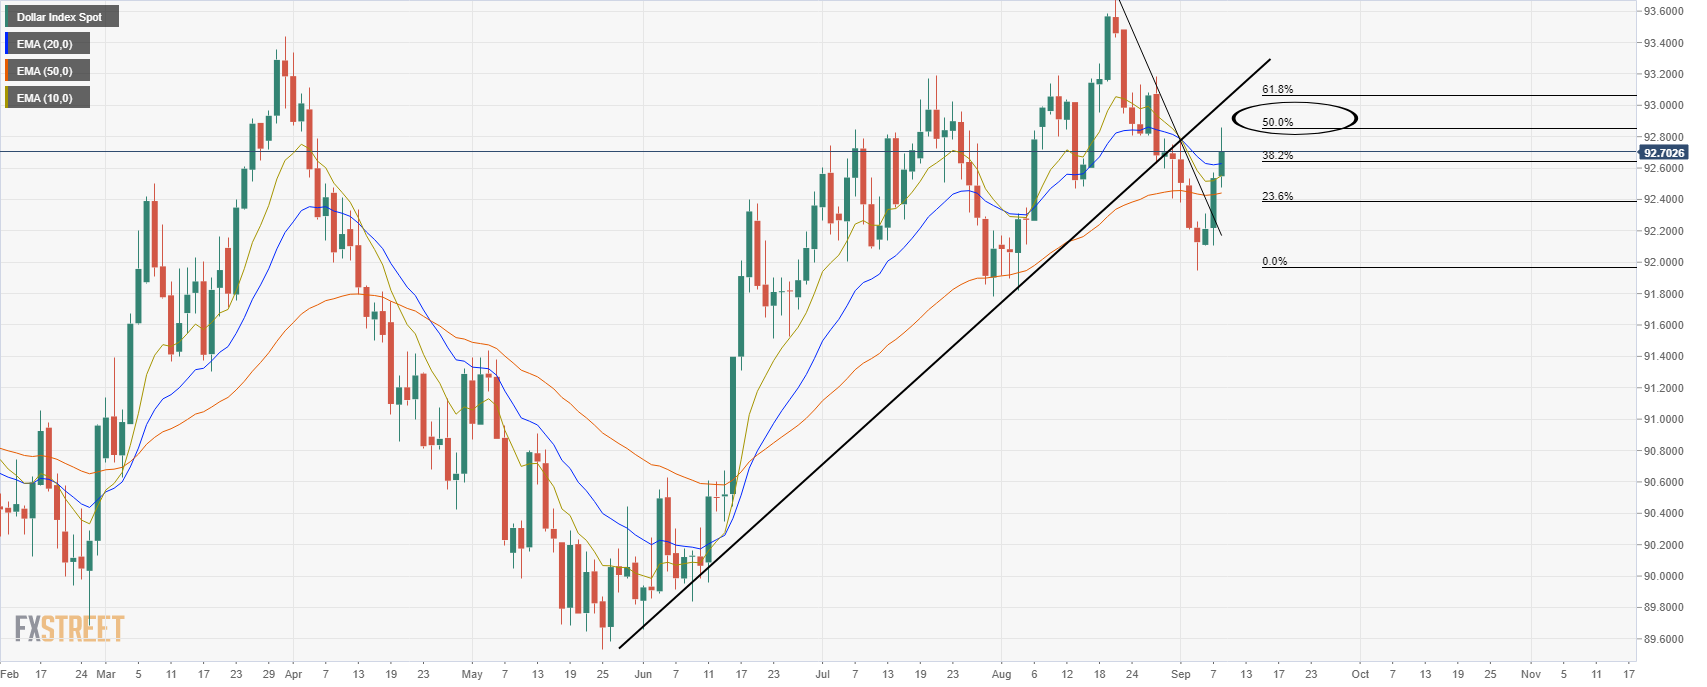
Daily charts, GBP/USD & DXY
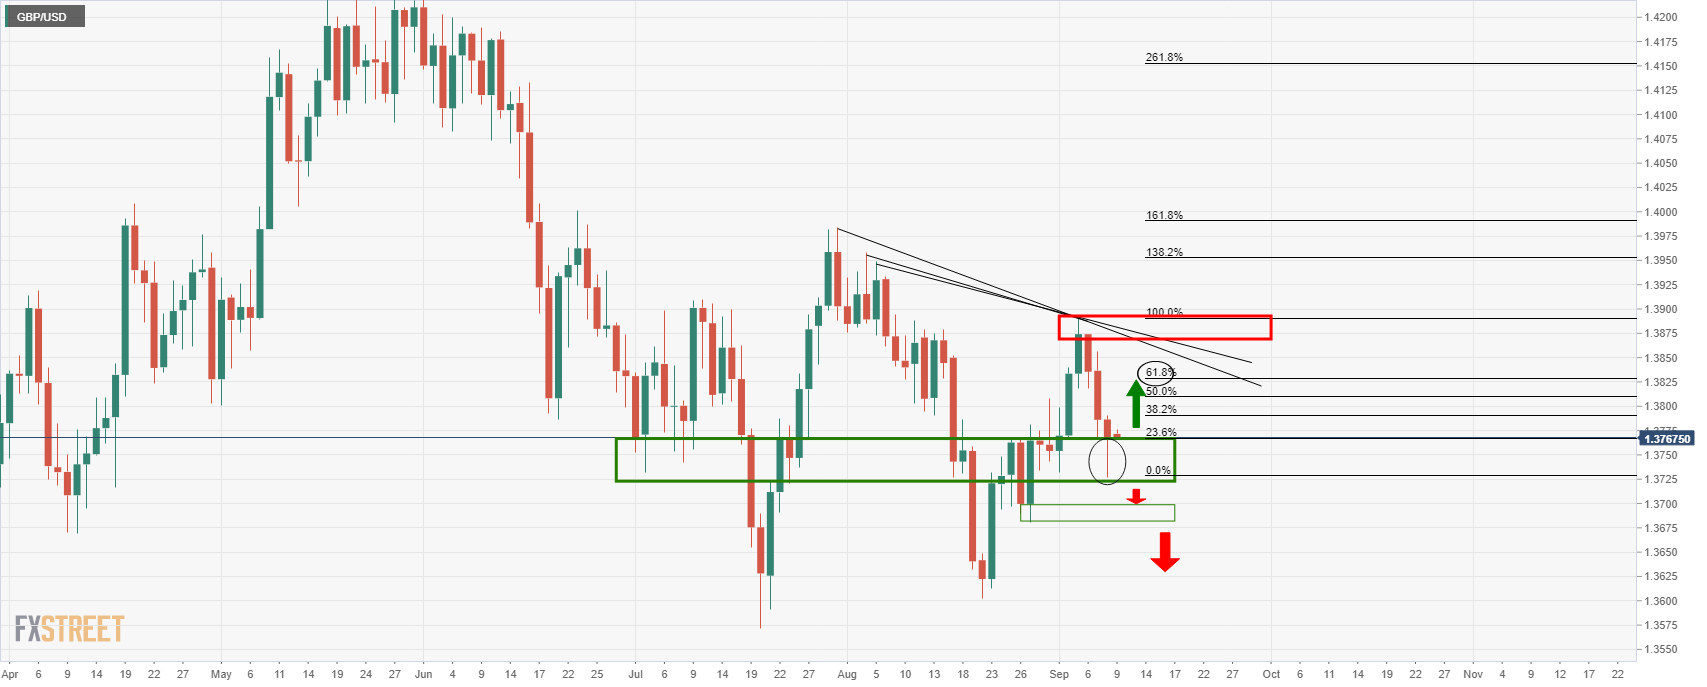
Moving up to the daily chart, the wick, (hourly correction from overnight lows), as eclipsed on the above chart, could be filled in on follow-through in the DXY to the upside.
DXY is currently on track for a restest of the counter trendline as follows:
If the DXY melts, on the other hand, then cable will be supported in the 1.3750s and be back on track to test the golden 61.8% ratio and towards the counter-trendline.
This area is between the 1.3830s and 1.3850s.


