- GBP/USD bulls are about to step in as the bears take profits into month-end.
- Eyes on key upside technical levels and zones.
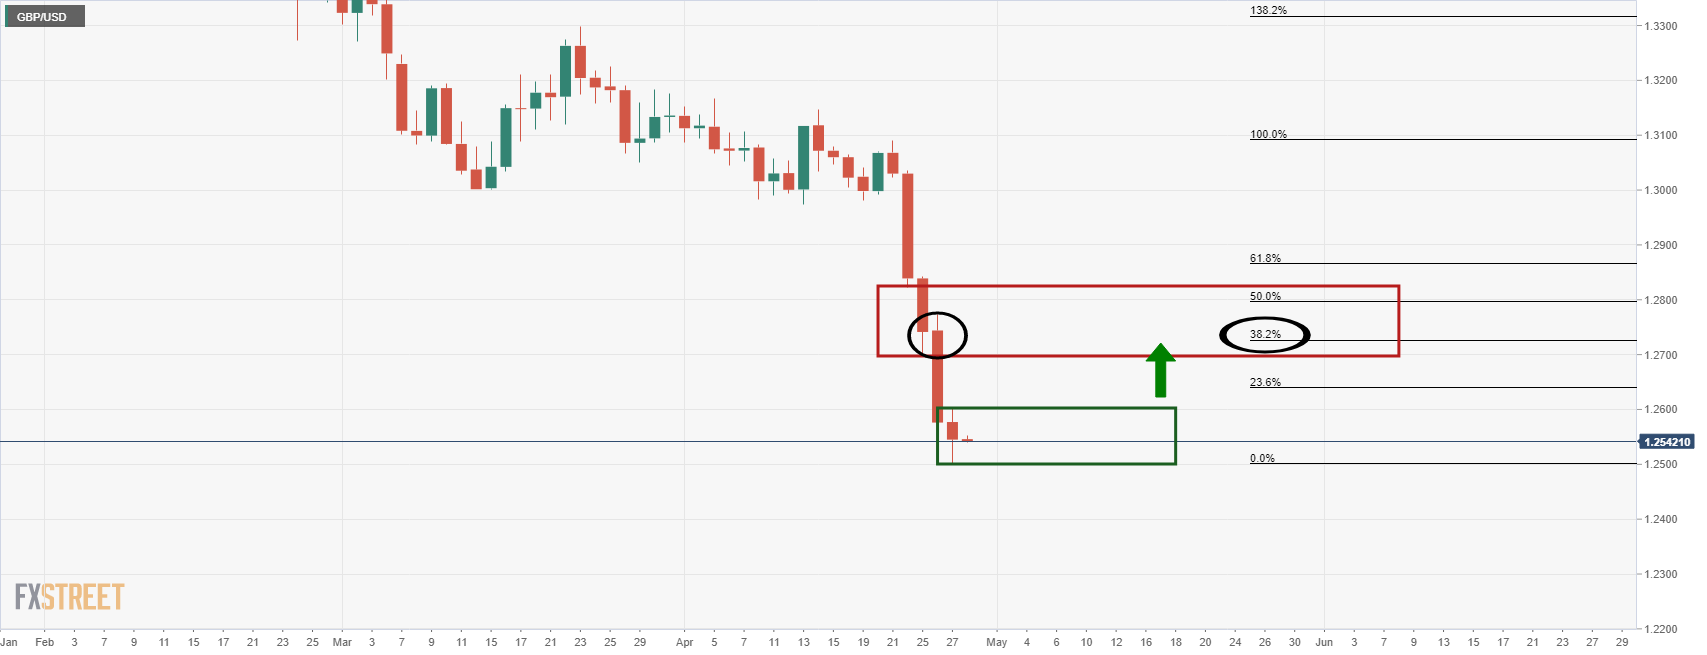
The price has moved in a parabolic move to the downside a correction is nigh. Scanning across the time frames, once the price breaks the prior day's highs with a daily close above it, the weekly VWAP that has a confluence of the 24 September 2020 lows around 1.2675 will be key and a 38.2% Fibo thereafter. The following illustrates the prospects of a bullish reversal in the coming days into month-end:
GBP/USD monthly chart
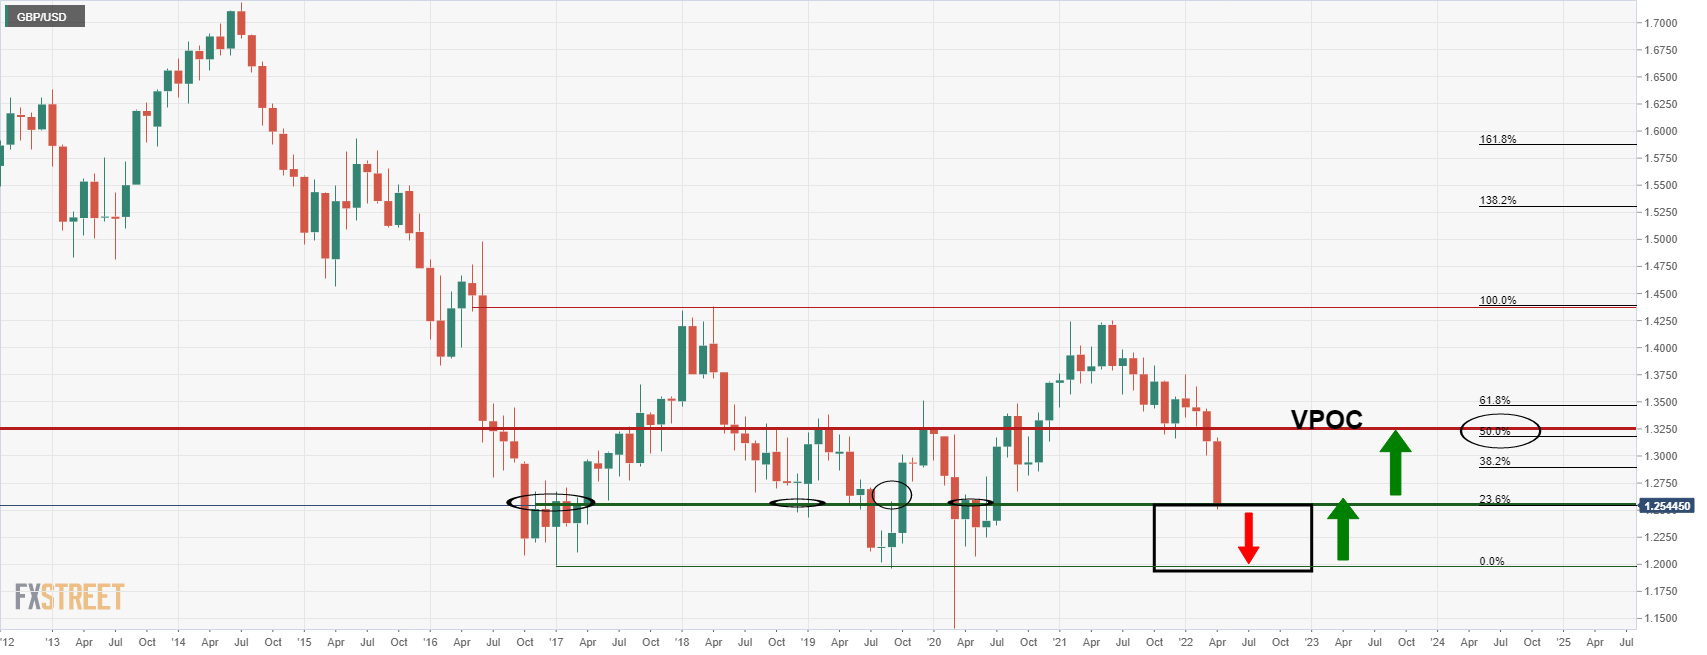
As illustrated, the price is now well below the Volume Point of Control, which is about the 50% mean of the monthly rotation channel's range, and while there is room to go to the downside, it is meeting a critical level. This level has been a support and resistance area repeatedly over the years. It would be expected to hold initial tests in a phase of accumulation on lower time frames. Therefore, traders can start to look for signs of accumulation in lower time frames and start to set sights on upside target areas.
GBP/USD weekly chart
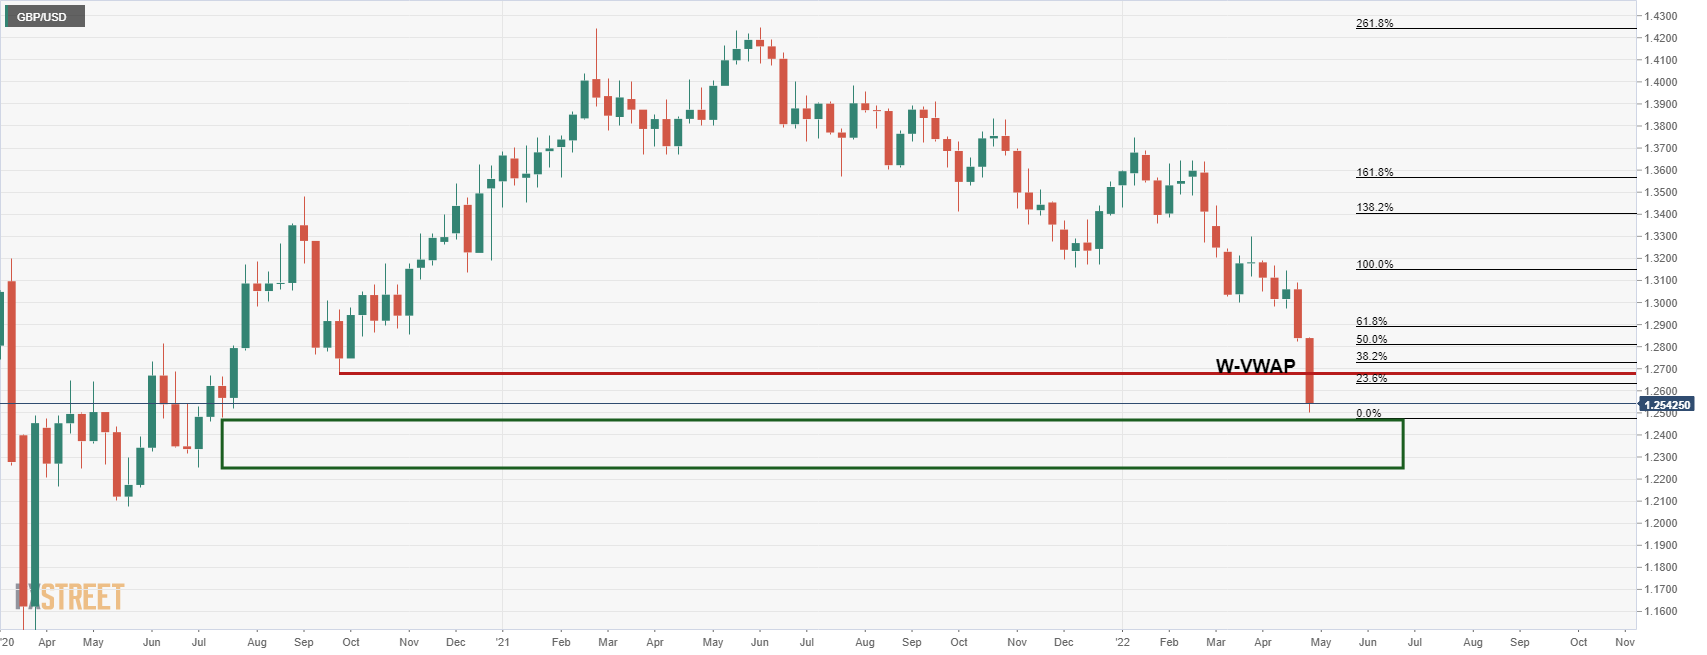
The Weekly VWAP is located around the Sep 2020 lows which will be regarded as a key level for any reversal that could occur in the foreseeable future. With that said, there still appears to be some room to go to the downside until the imbalance of the July 2020 rally is fully mitigated.
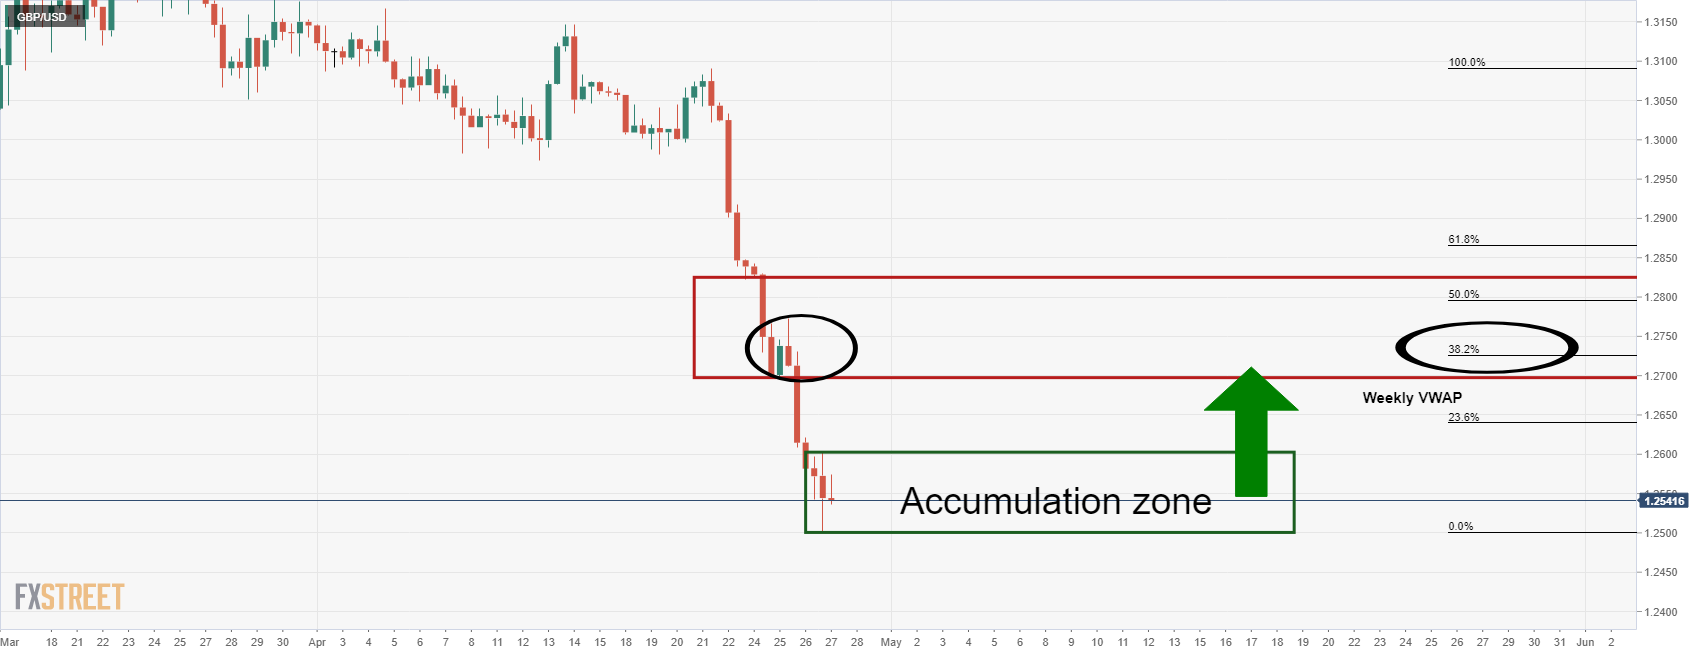
GBP/USD daily chart
The close on Wednesday was bearish, technically, but it was not a convincing continuation candle and more like a doji. Nevertheless, the bulls will need to see a bullish close or two, preferable bullish engulfing and above the Wednesday highs. A 38.2% Fibonacci retracement level, at this juncture, would roughly coincide with the rotation area around it, slightly through 1.27 the figure.
This can be seen better on a 4-hour time frame as follows:
GBP/USD H4 chart