
- The daily chart offers compelling upside bias as bears start to run out of juice.
- Bulls waiting on the sidelines for bullish structure at this juncture.
Following the progression of the price action and market structures across the various time frames in GBP/USD, it can be concluded that the bulls are now in the most favourable position.
As per the prior analysis, whereby the bears were taking up control, the price did indeed melt to the downside as forecasted.
Prior analysis, hourly chart
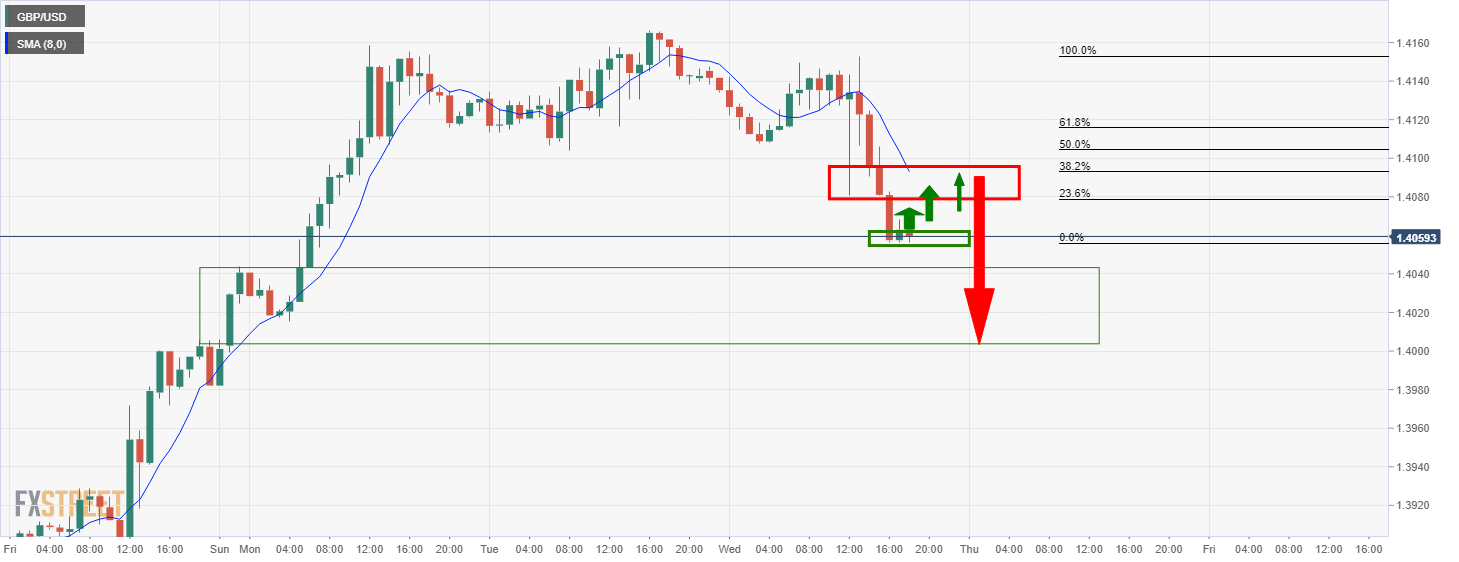
'Should the price drift higher without leaving multiple bottoms on an hourly basis, there could be prospects of sellers taking back control from resistance.
Sellers would seek to break the hourly lows which would result in a bearish continuation towards the 50% mean reversion of the prior daily bullish impulse.'
Tracking price action on the hourly charts
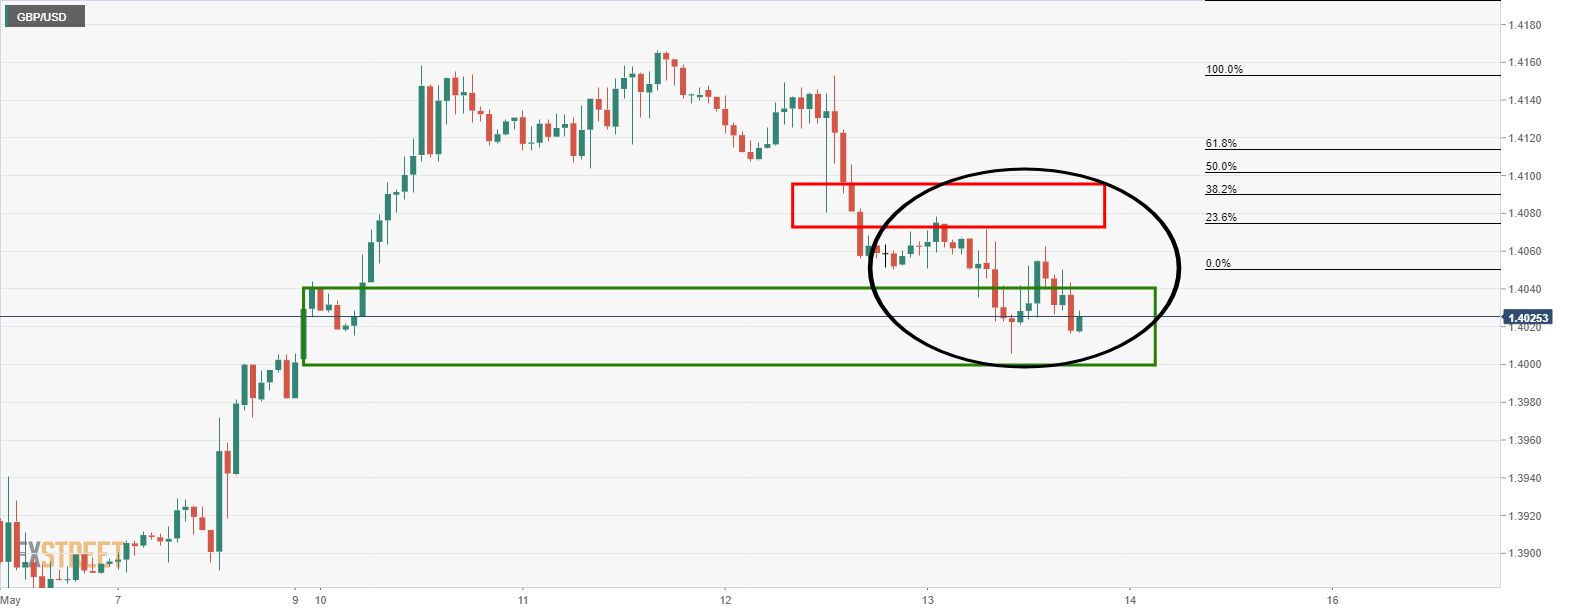
New York price action, above, shows the price deterioration into demand territory, as forecasted.
We have seen demand come in again in more recent trade as follows:
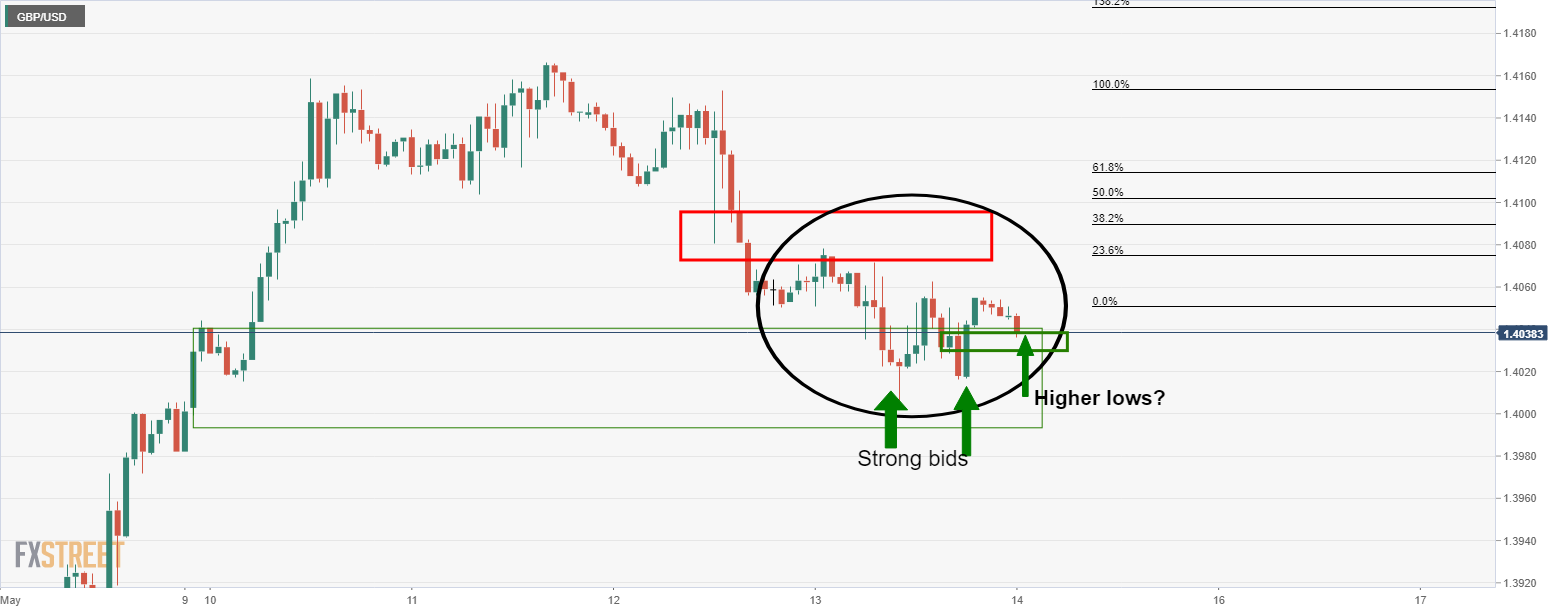
In Asia, the price is testing the bullish commitments and there are prospects of a higher low which would be a bullish scenario.
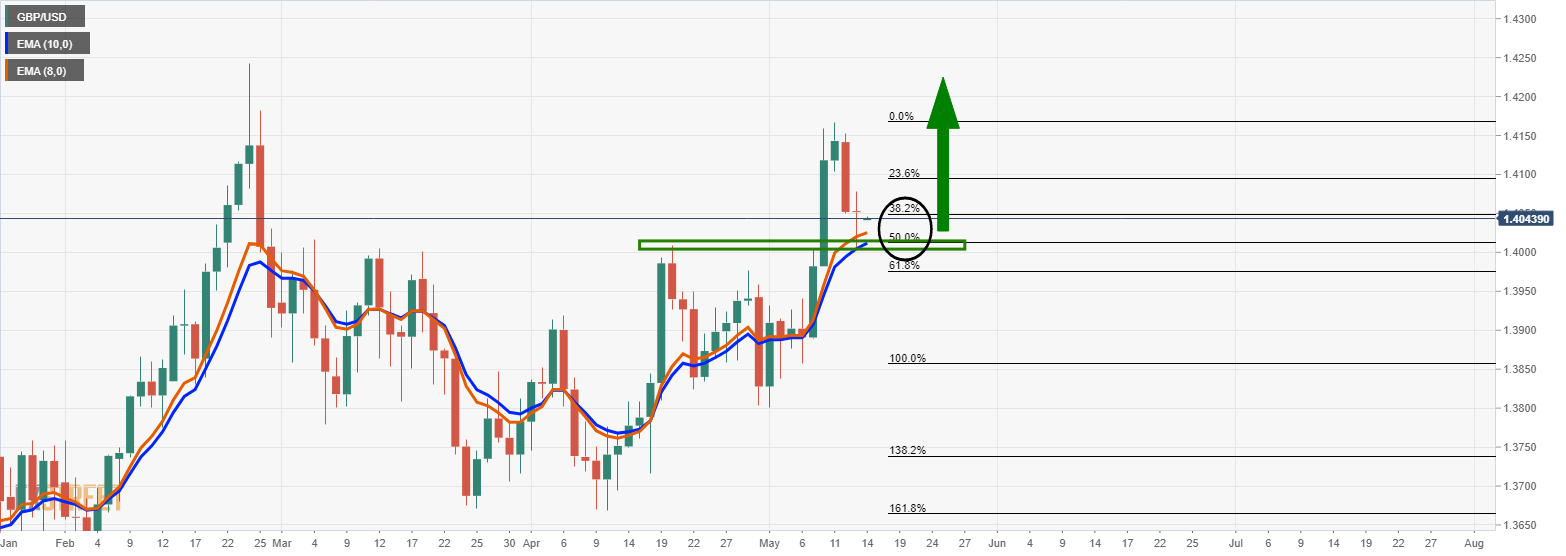
Indeed, the bulls are now stepping back in and the daily conditions have ripened for a bullish advance but the price is so far contained by a build-up of lower time frame resistance.
Daily chart
4-hour chart
Nevertheless, the 4-hour chart is forming a bullish reverse head and shoulders formation and on completion, the bullish price action could well burst into life.
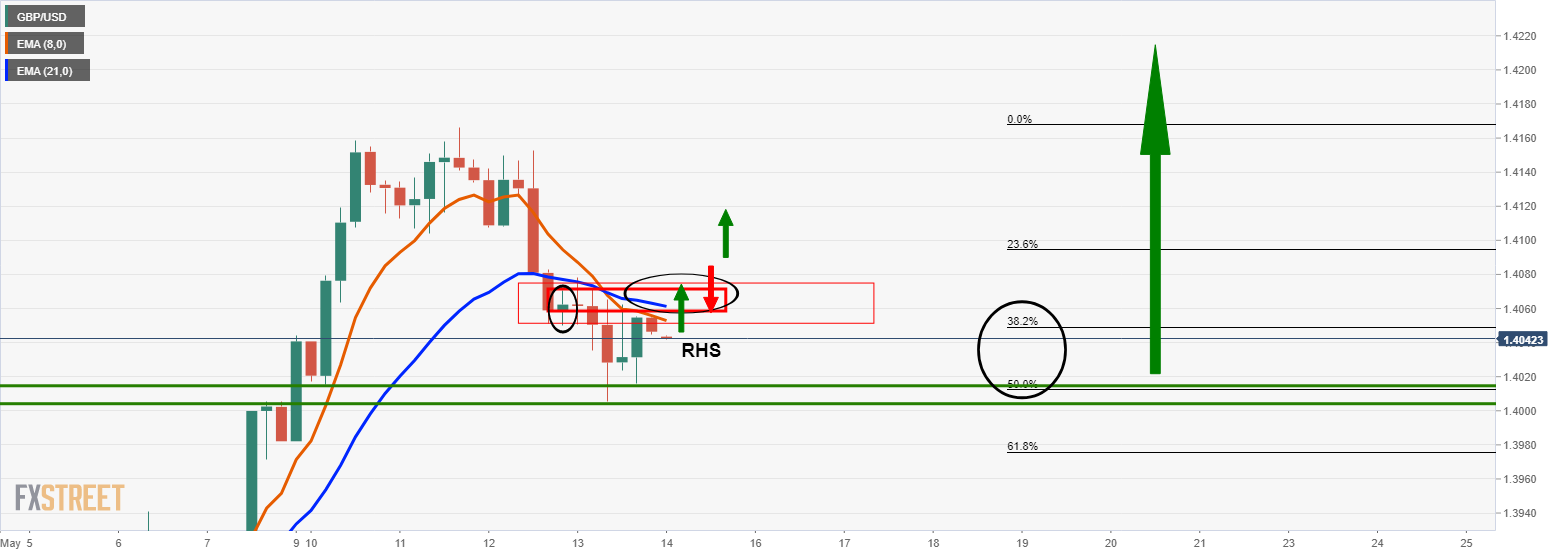
The right-hand shoulder of the bullish reverse head and shoulders is in the process of being formed.
Bulls will want to see the price break the prior highs within this formation and hope for a discount on a retest of the structure before committing to the bullish thesis.


