
- GBP/USD bulls are coming out of hiding to close the gap.
- US dollar has touched 110.00 DXY, but have the bulls got the legs?
GBP/USD has been a choppy start to the week with some jitters in the markets from the weekend noise surrounding the euroland energy crisis. This has fuelled a risk-off bid into the US dollar and weighed on the forex space with gaps across major pairs.
Nevertheless, there has been a correction in Tokyo and the following analysis is from a bullish perspective for cable given the lofty heights in the DXY touching the psychological 110 level.
GBP/USD weekly charts
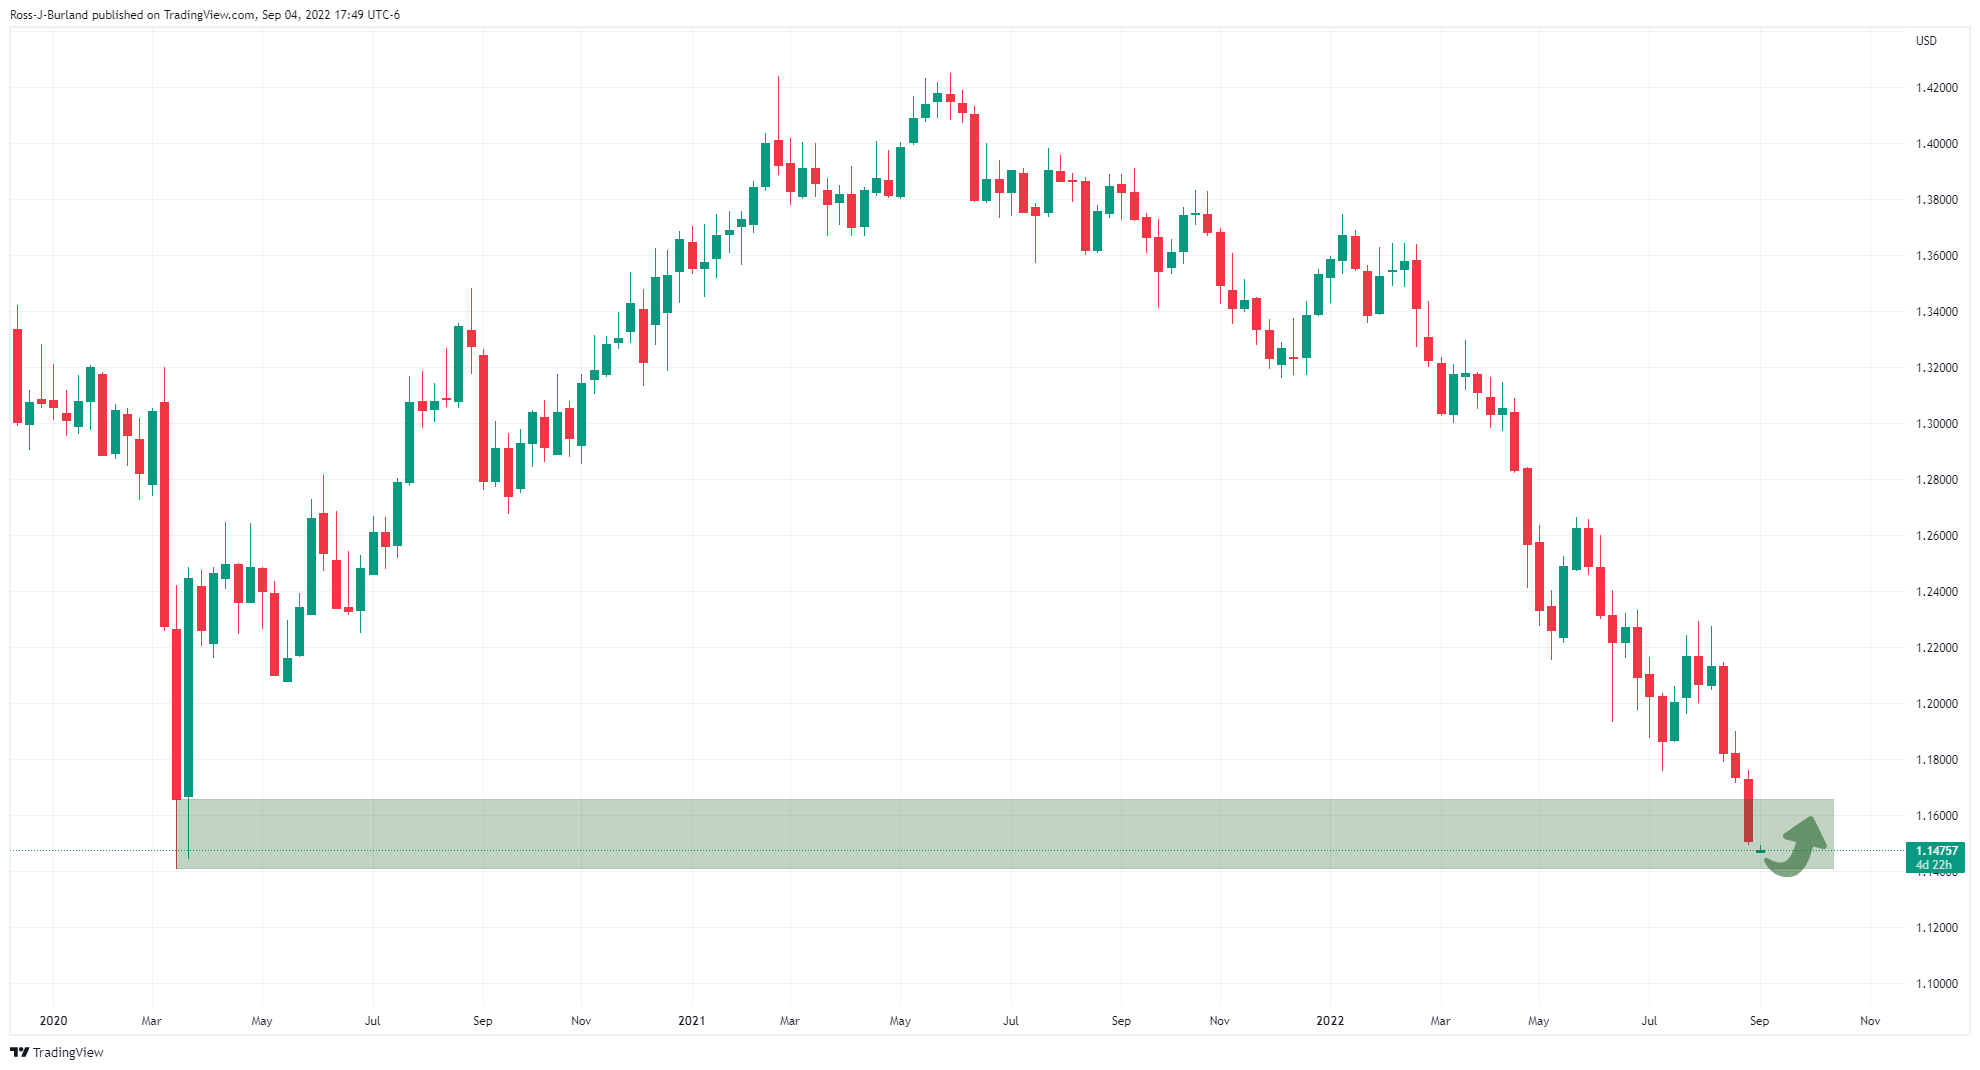
The pair have run into demand territory as per the weekly chart, so a phase of accumulation would be expected for the week ahead.
The M-formation is also compelling:
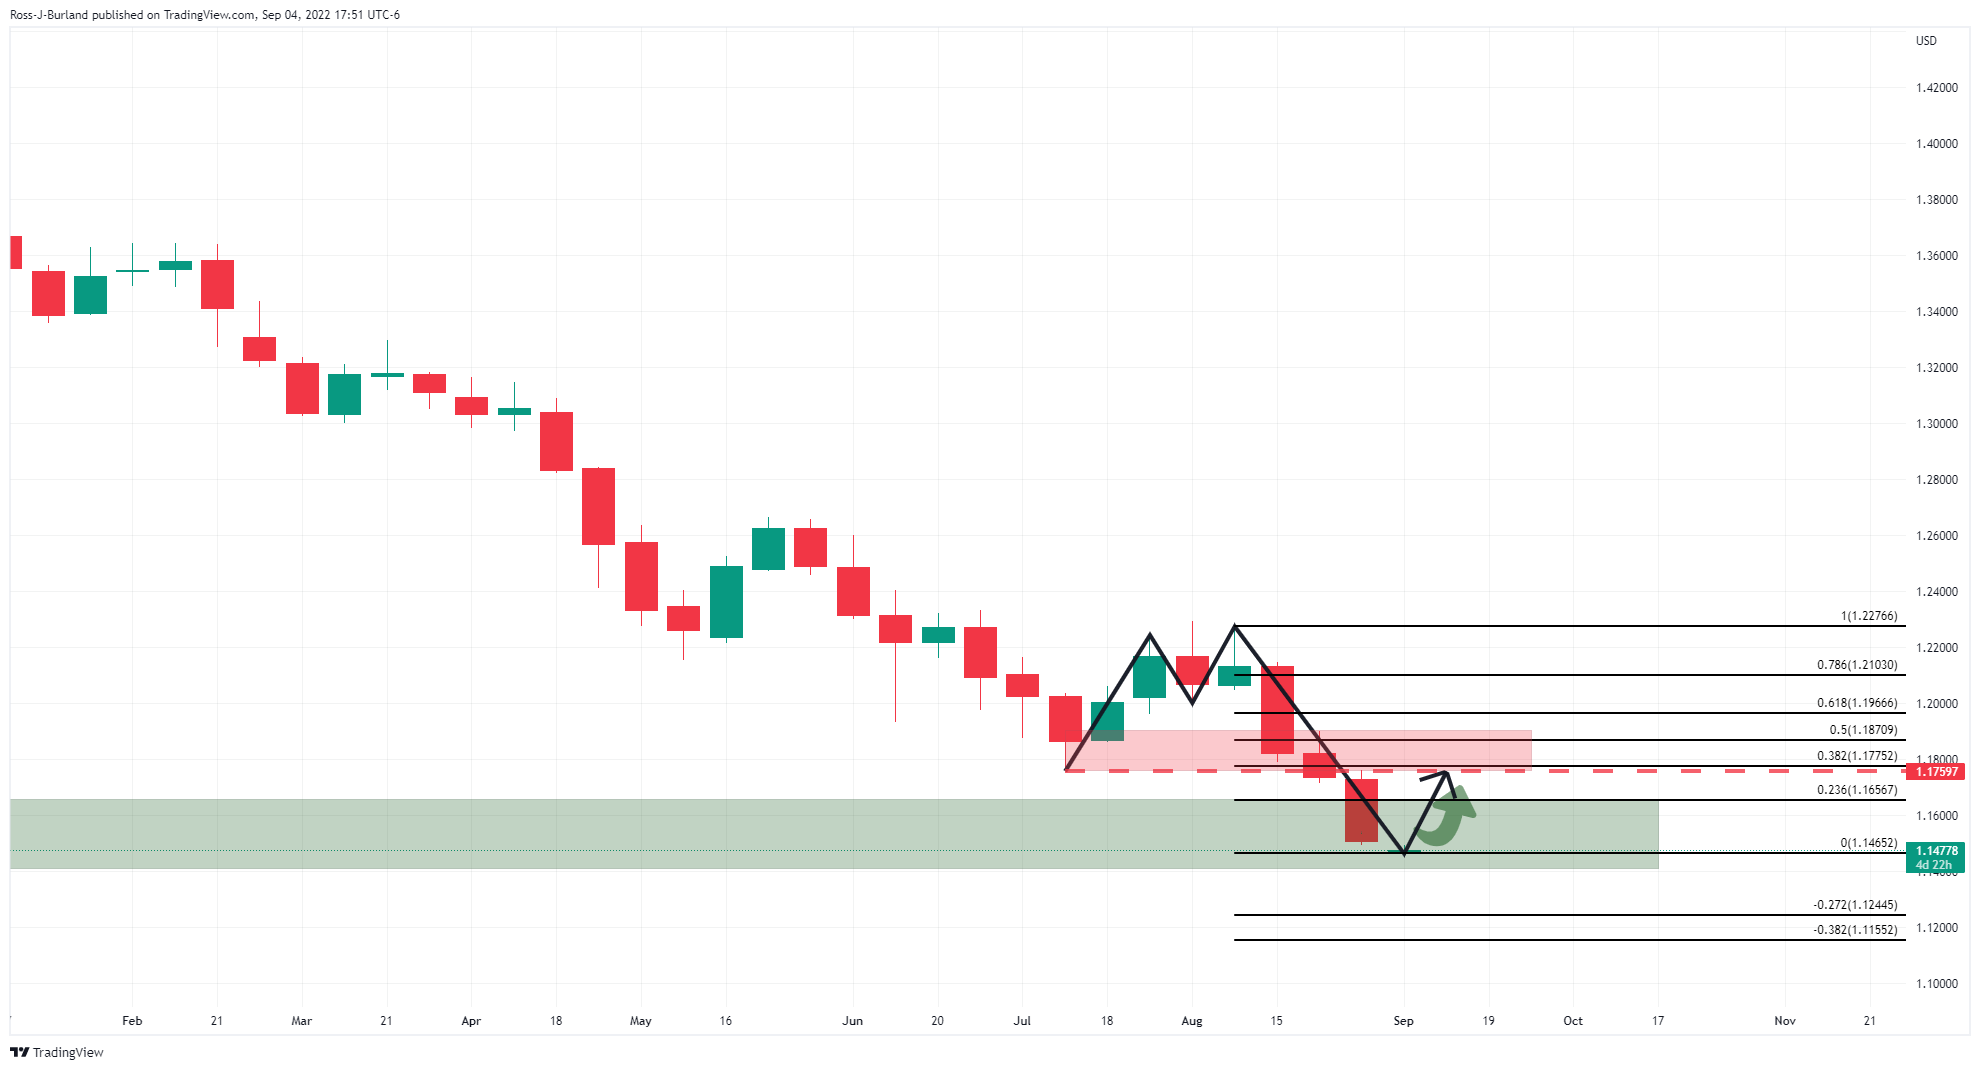
This is a reversion pattern and would be expected to see the price correct into the next area of resistance that, in this case, has a confluence with the 38.2% Fibonacci retracement level.
GBP/USD daily chart
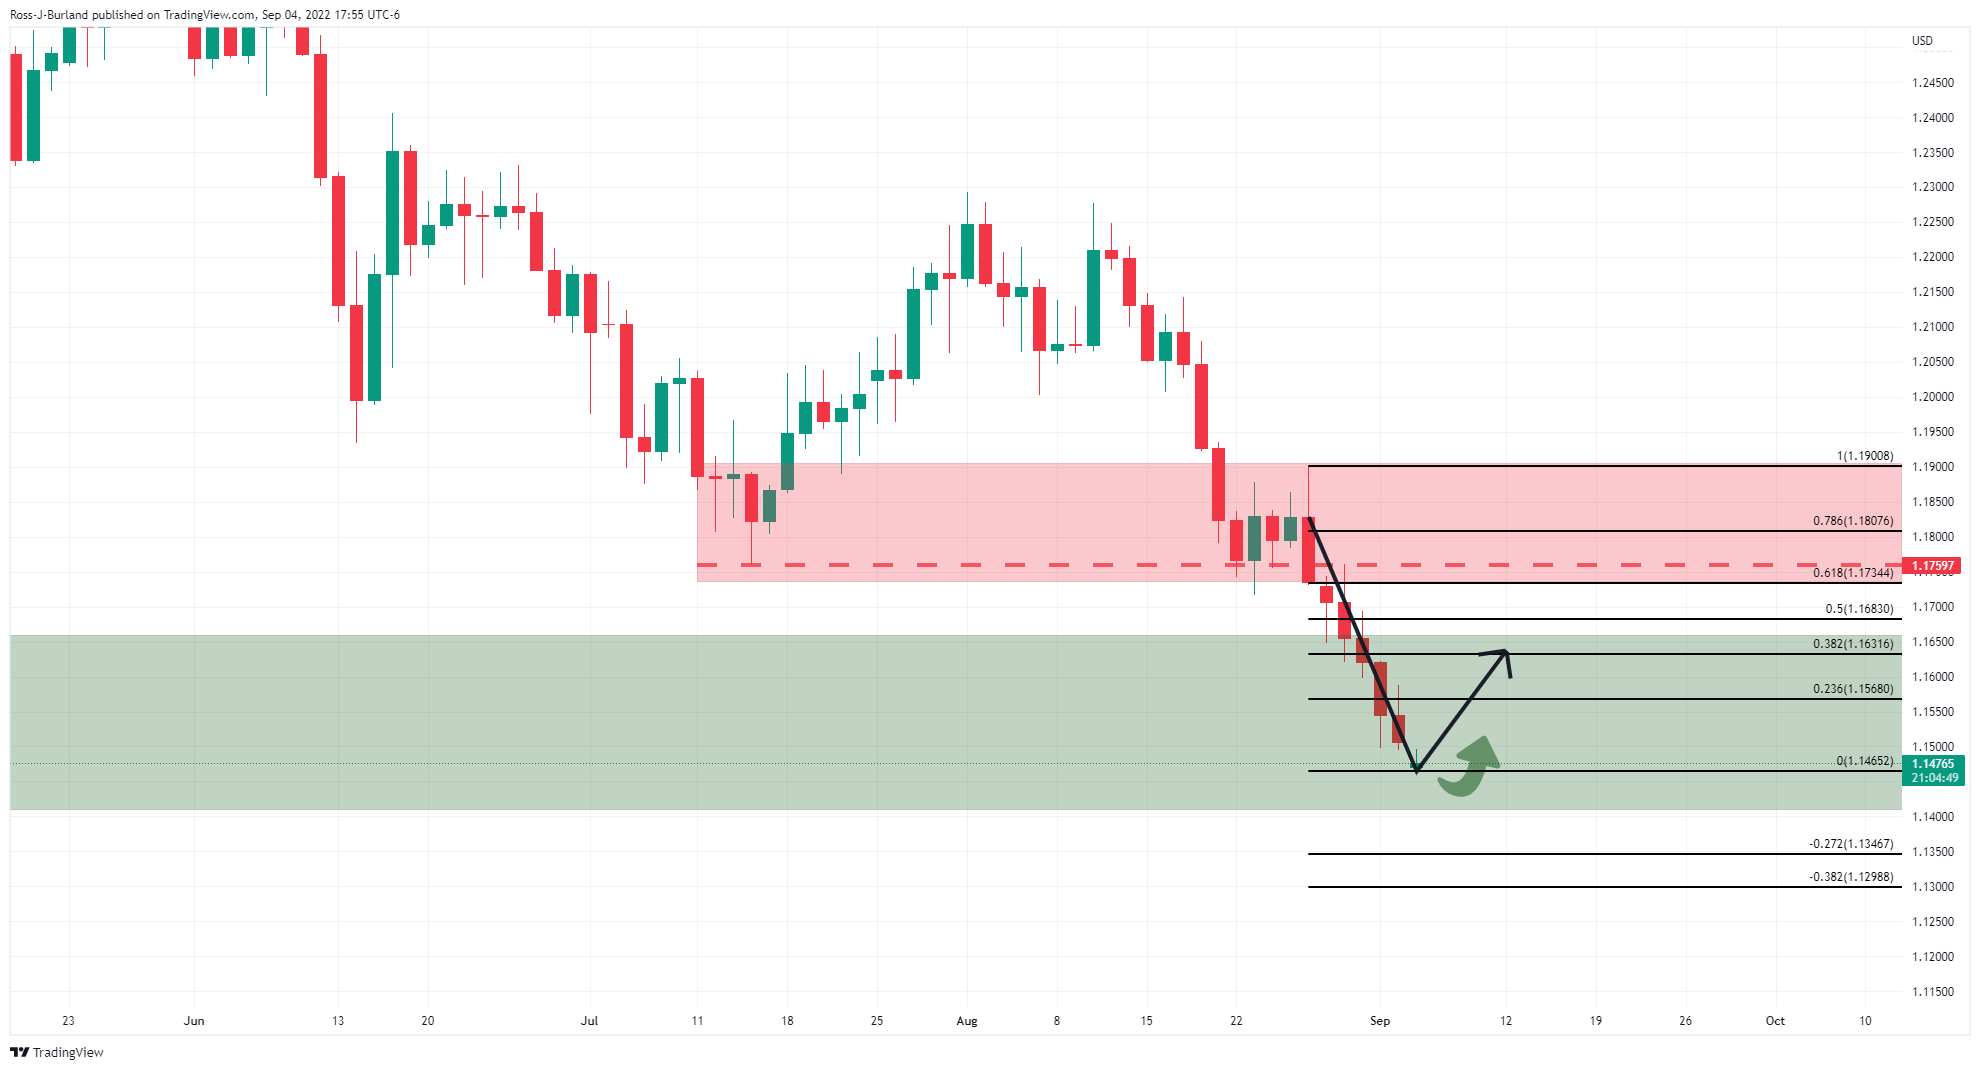
This chart is very overextended and a correction would be expected.
GBP/USD H4 chart
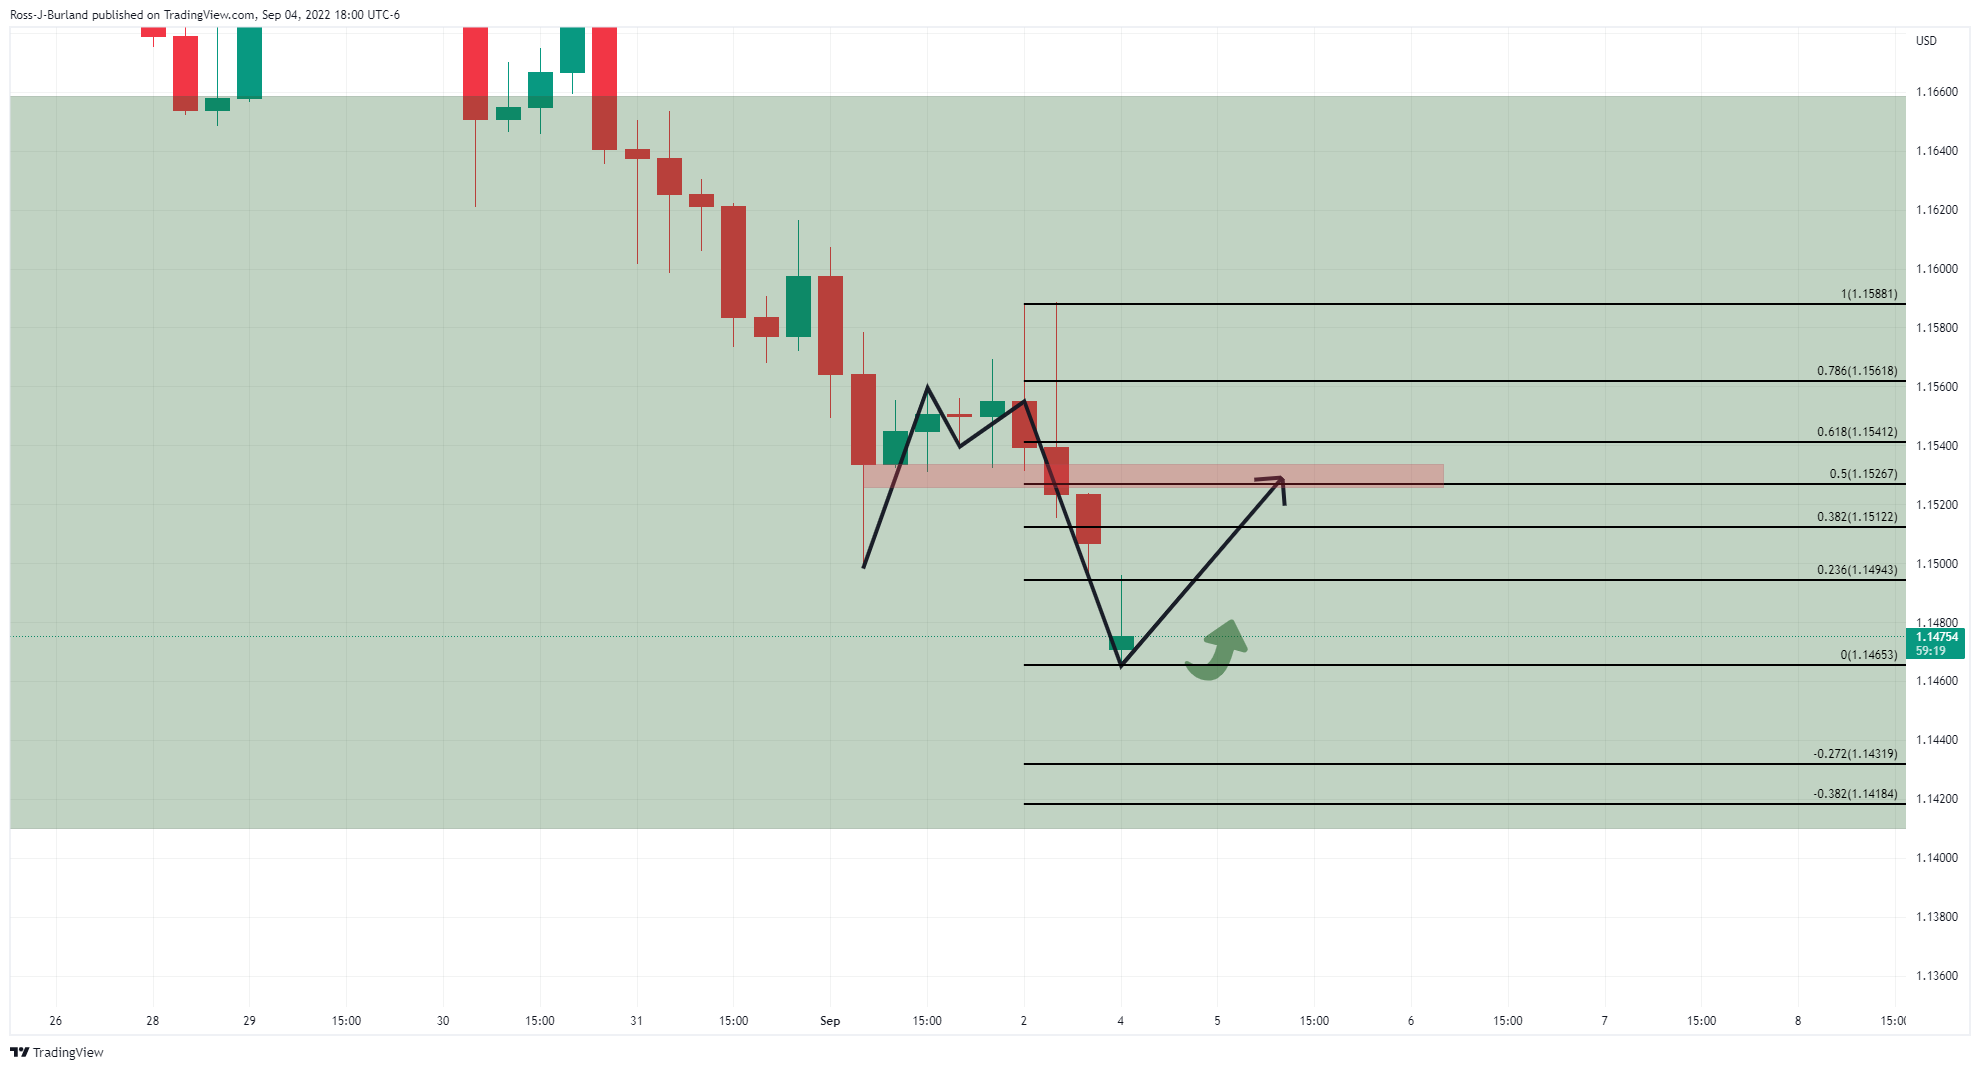
The four-hour chart is offering a bullish reversion pattern as well, so a move to mitigate the gap with a bullish 4-hour close could be expected to encourage further demand into a higher correction for the sessions ahead.
DXY bearish bias
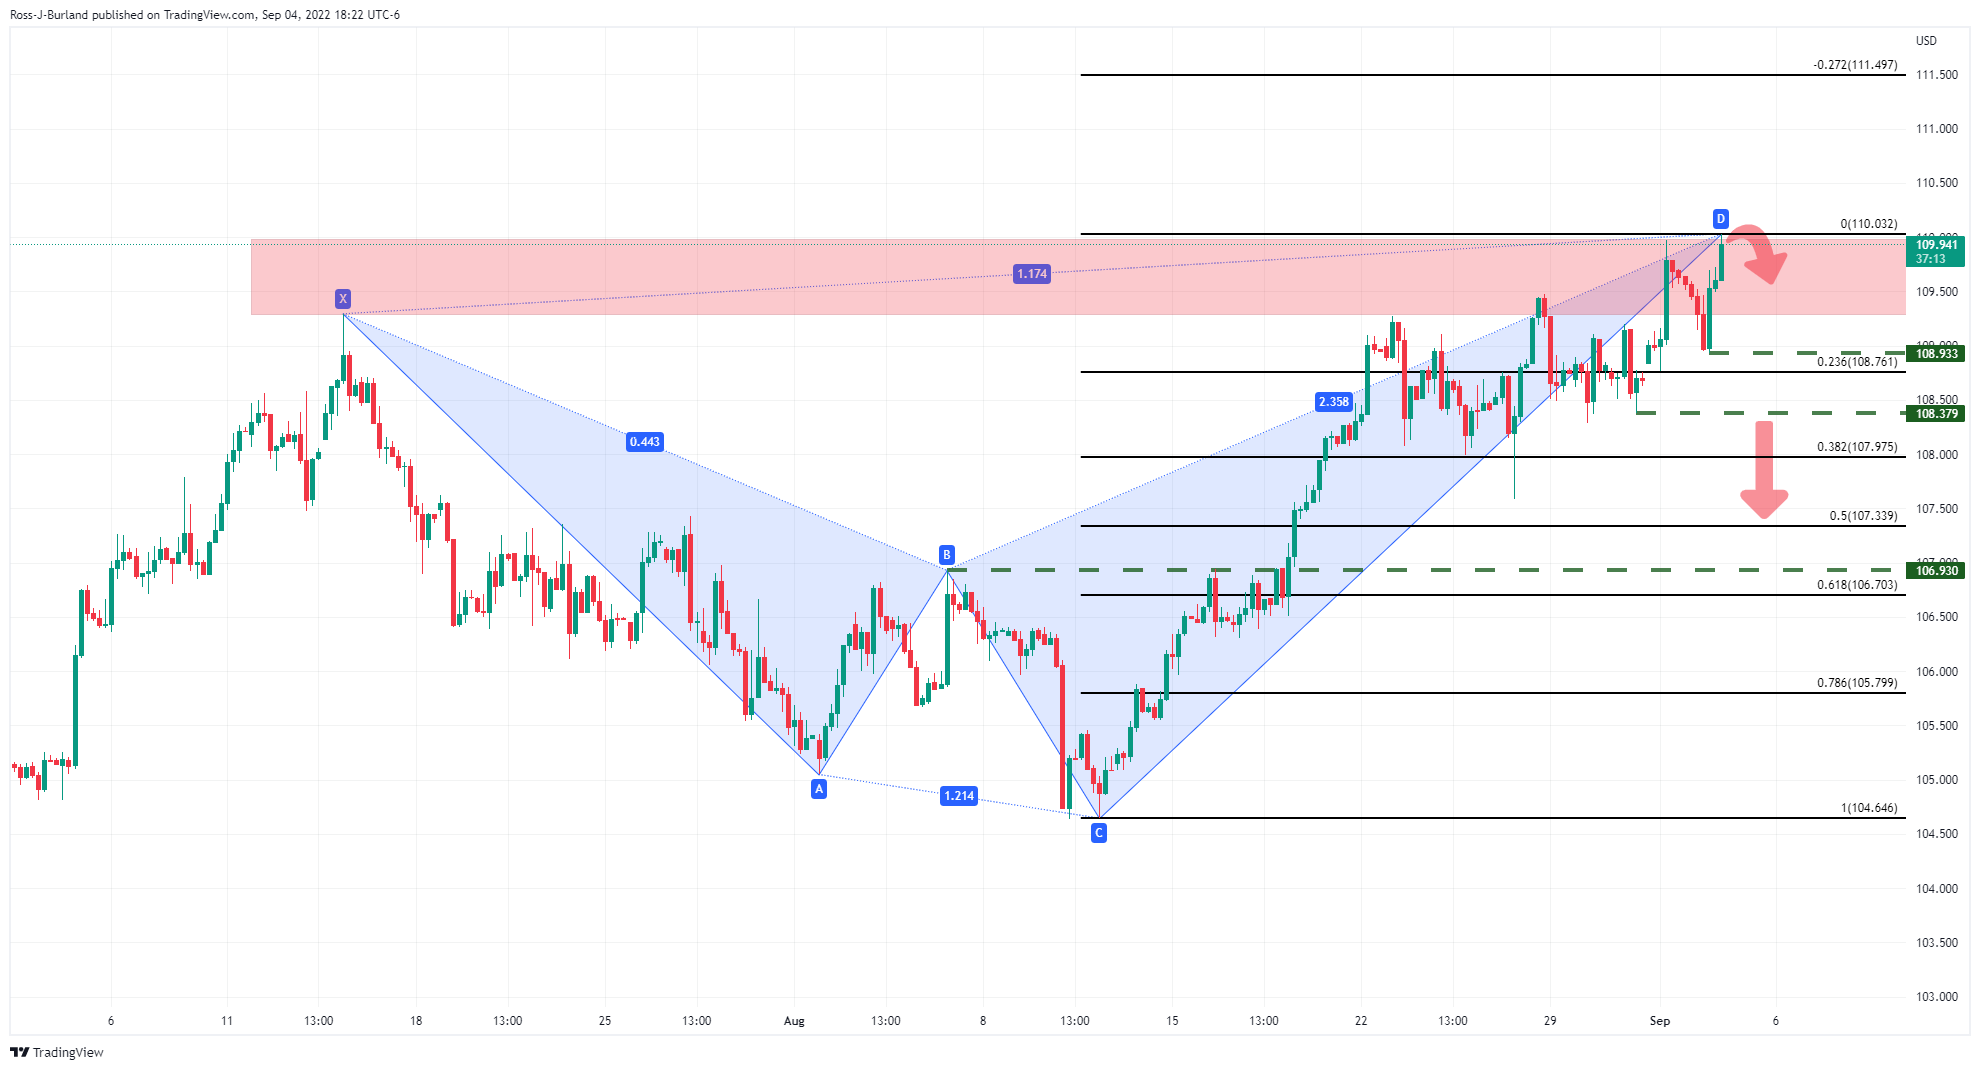
The US dollar has touched 110 in trade to start the week but the Shark harmonic pattern is bearish. With that being said, there is room for the index to run until it meets January 2002 lows at 110.98:
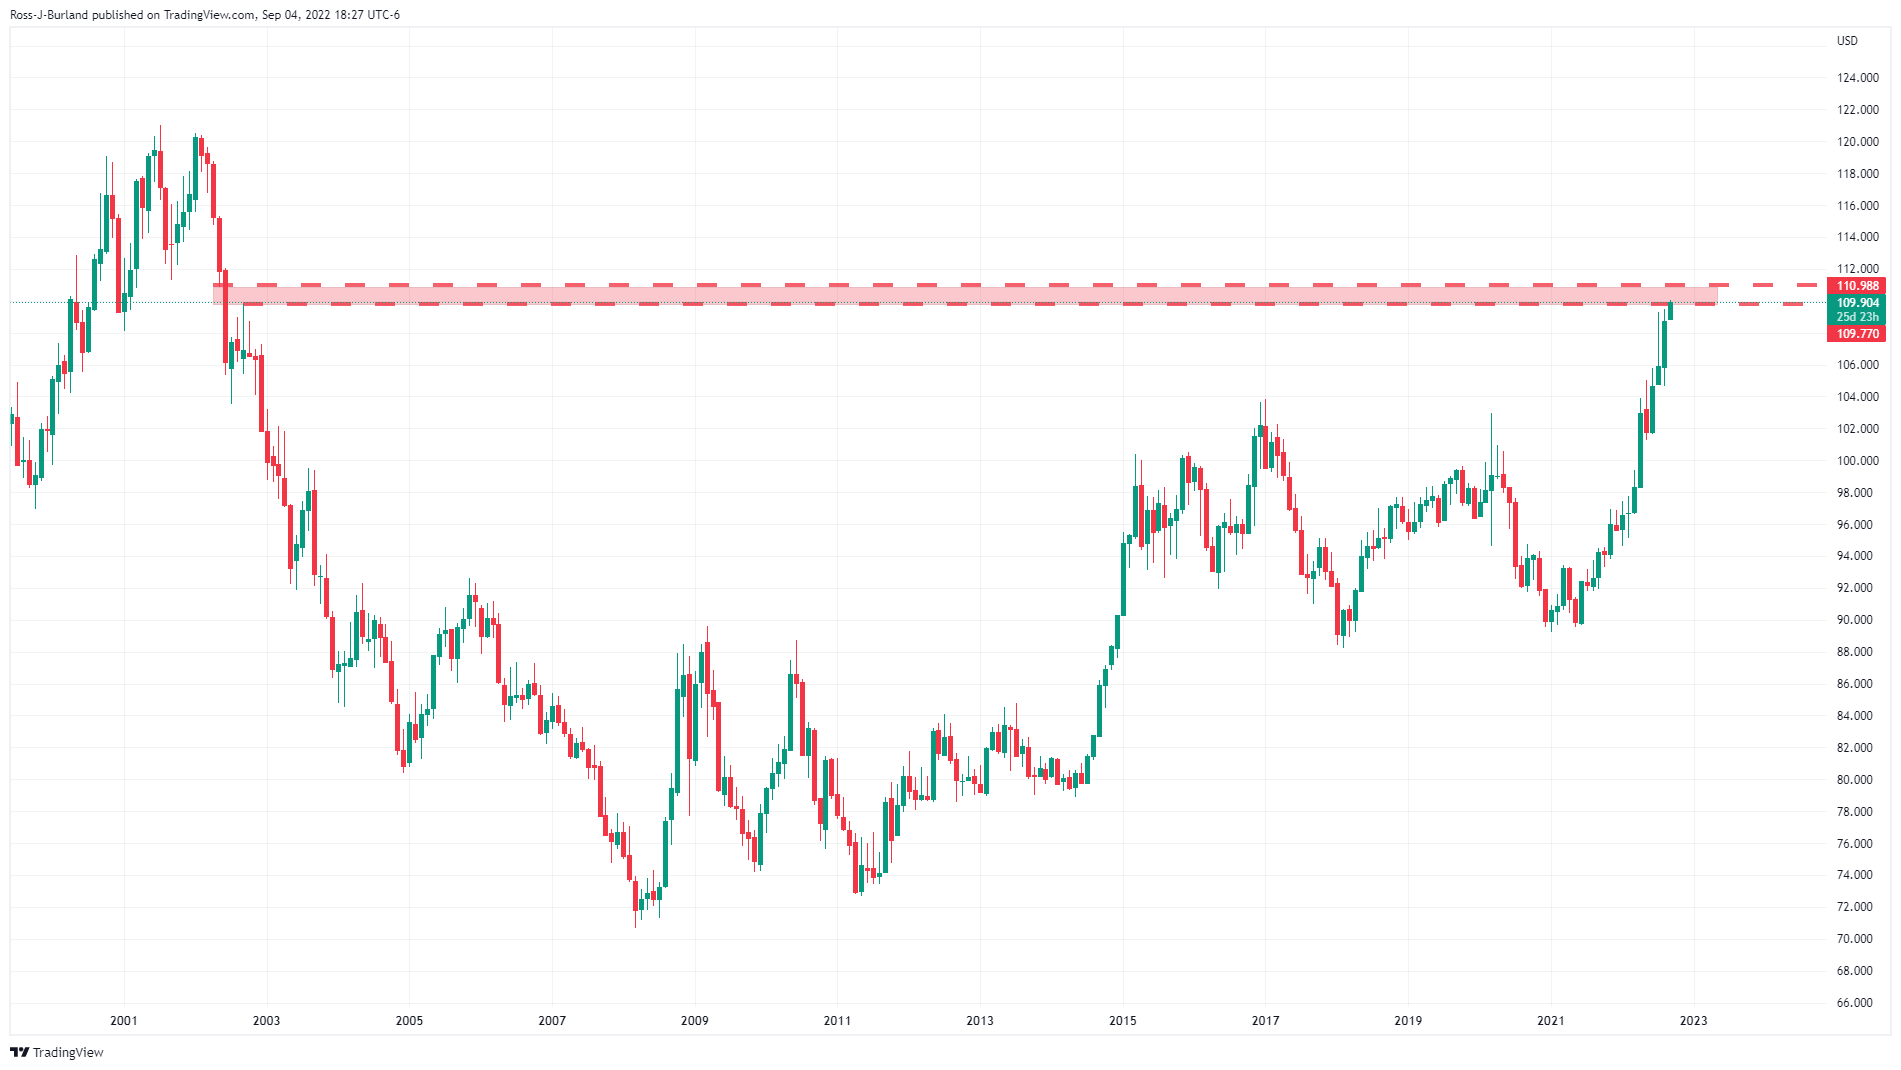
(Monthly chart)


