- GBP/USD regained positive traction on Friday and climbed back closer to the monthly high.
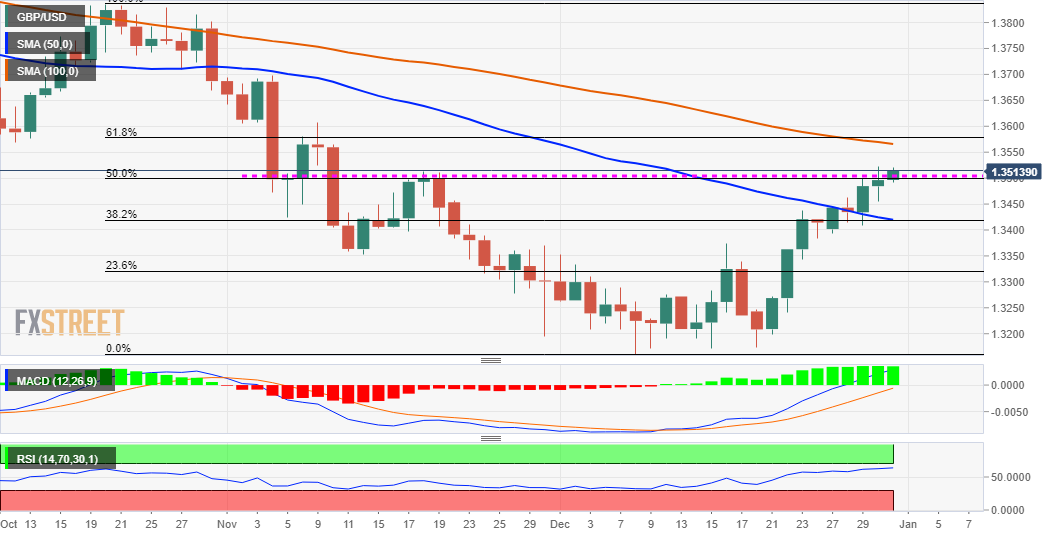
- The set-up supports prospects for a move towards testing the 1.3565 confluence resistance.
- Only a sustained break below the 1.3400 mark will negate the near-term positive outlook.
The GBP/USD pair edged during the early part of the European session and shot closer to the highest level since November 10, around the 1.3520 area touched in the previous day.
From a technical perspective, a move back above the 50% Fibonacci level of the 1.3834-1.3161 downfall could be seen as a fresh trigger for bullish traders. This, along with bullish technical indicators on the daily chart, supports prospects for a further near-term appreciating move.
Hence, a subsequent move toward testing the next relevant hurdle, around the 1.3565 confluence region, now looks like a distinct possibility. The mentioned hurdle comprises 61.8% Fibo. level and the 100-day SMA, which if cleared decisively should pave the way for additional gains.
On the flip side, the overnight swing low, around the 1.3455-50 area, now seems to protect the immediate downside. Any further decline could be seen as a buying opportunity near the 38.2% Fibo. level/50-DMA confluence resistance breakpoint, around the 1.3420-15 region.
This, in turn, should help limit the downside near the 1.3400 round-figure mark. Some follow-through selling below the 1.3385-75 region might shift the bias in favour of bearish traders. The GBP/USD pair could then accelerate the fall towards the 23.6% Fibo. level, around the 1.3320 area.
GBP/USD daily chart