
- GBP/USD bears seeking a downside continuation as forex volatility remains sky-high.
- The bulls are attempting to break a key level of resistance on the hourly chart.
GBP/USD bulls are climbing towards a 23.6% Fibonacci retracement of the lastest bearish hourly impulse. The following illustrates the prospects, however, of a downside continuation and a break below 1.32 the figure for the days ahead.
GBP/USD daily chart
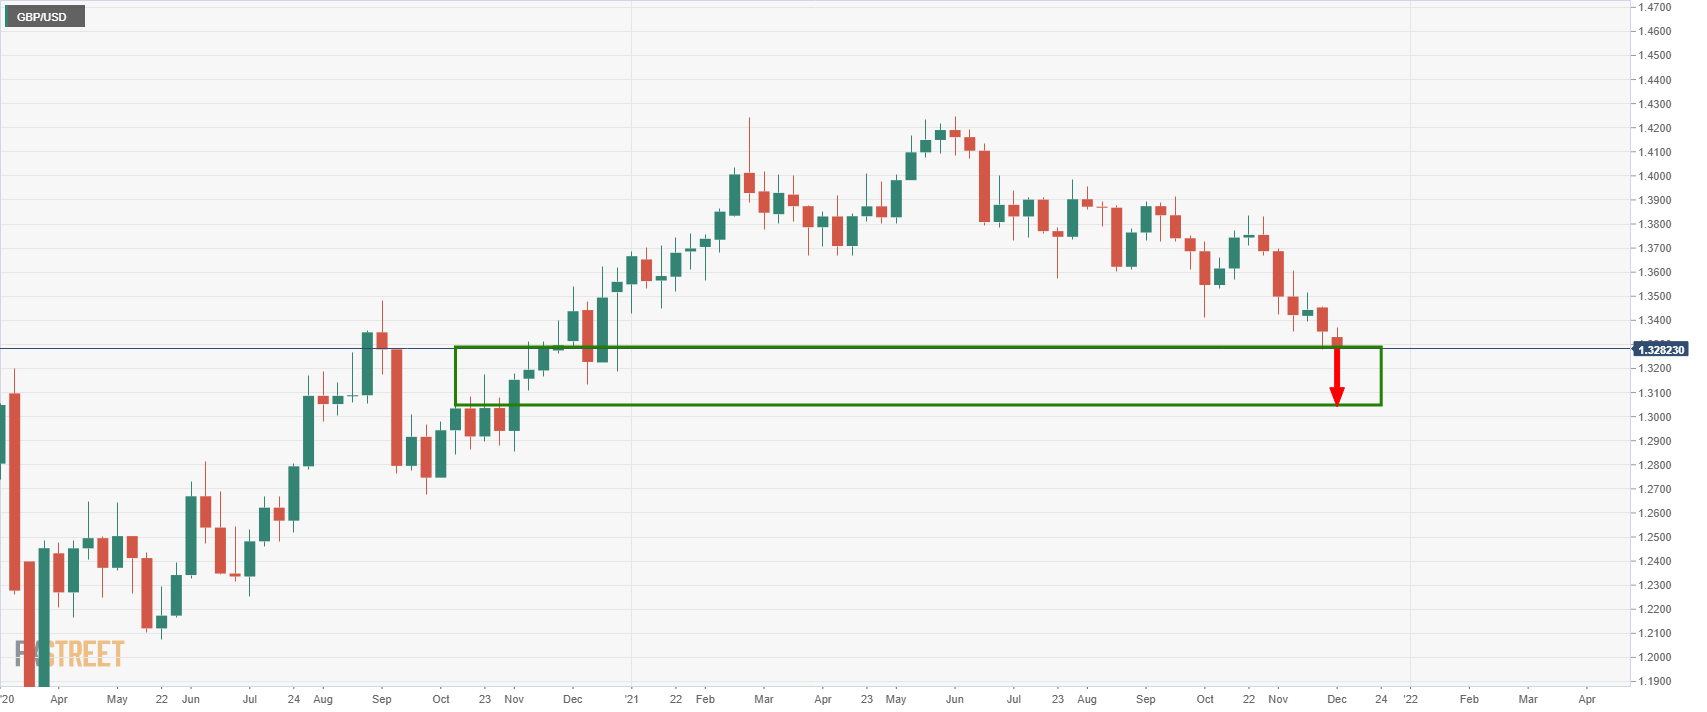
The chart above illustrates a scenario whereby the price could fall as deep as 1.3050 in the coming days. However, 1.3200 will be the first major challenge.
GBP/USD H1 chart
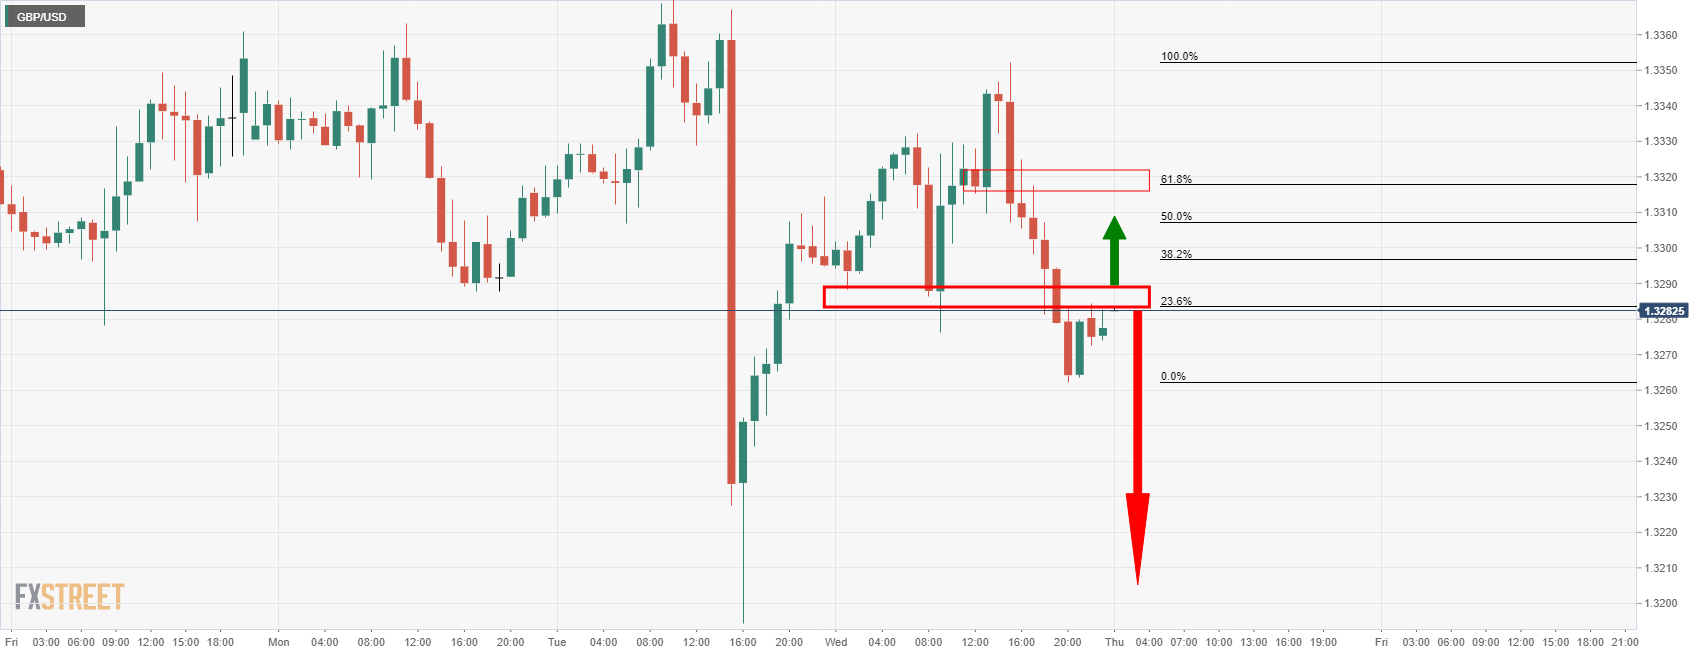
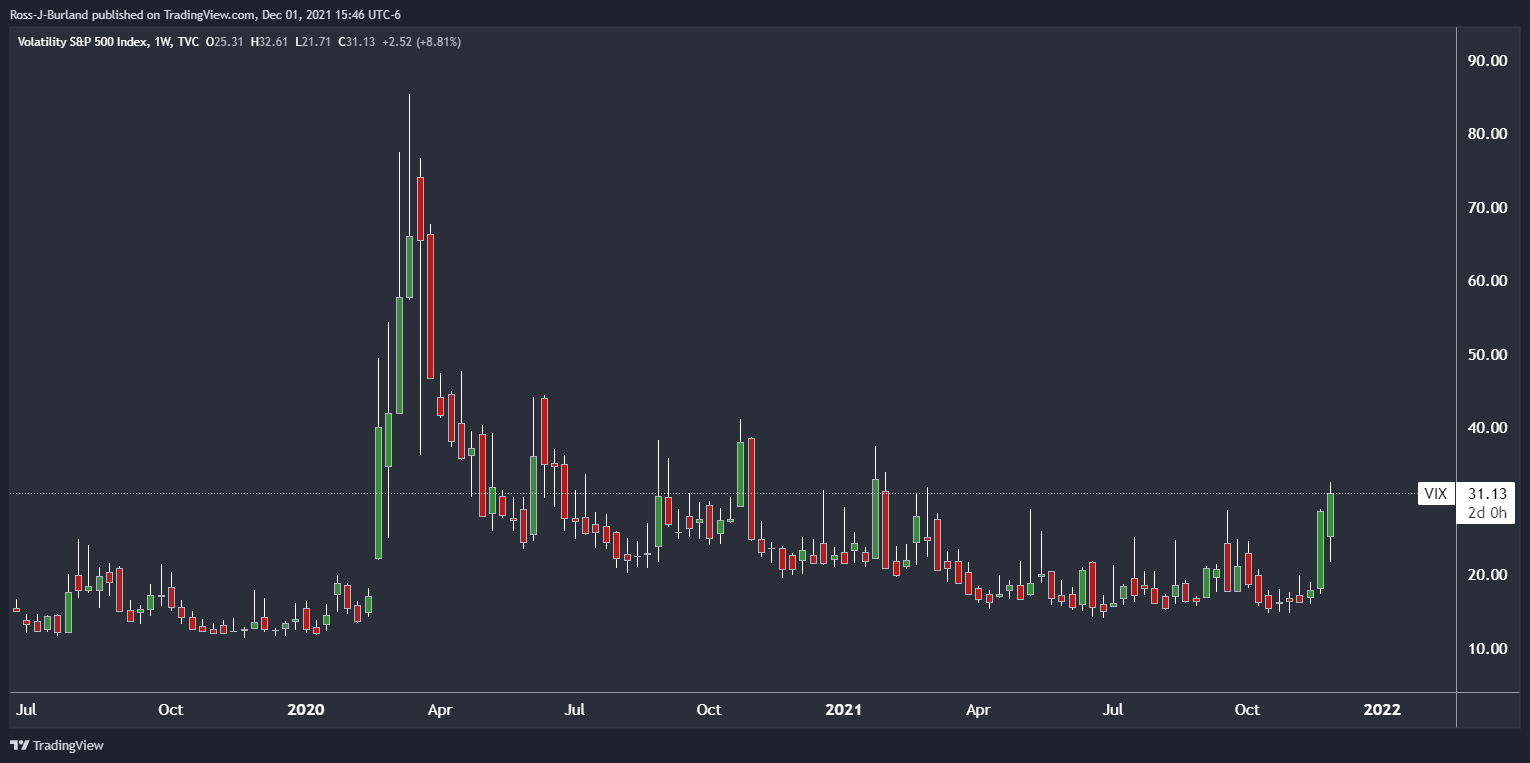
The price is meeting a meanwhile resistance that could see the correction phase-out and lead to a downside continuation. The resistance area is reinforced by a 23.6% Fibonacci level as well. However, a break of here could see a deeper correction, potentially to as far as the 61.8% golden ratio. With that being said, the bias is with the bears at this juncture with both the VIX and forex volatility sky-high:
-637739919150088109.jpg)


