- GBP/USD staged a goodish rebound from a short-term ascending trend-channel support.
- The set-up favours bullish traders and supports prospects for a further appreciating move.
- A sustained break below the 1.3780 region is needed to negate the constructive outlook.
The GBP/USD pair built on its steady intraday positive through the first half of the European session and climbed to fresh daily tops, around the 1.3835 region in the last hour.
The British pound got a minor lift following the release of hotter-than-expected UK consumer inflation figures. On the other hand, the US dollar bulls remained on the defensive amid fading hopes for the Fed taper announcement at the upcoming meeting on September 20-21. The combination of factors assisted the GBP/USD pair to stall the previous day's pullback from the 1.3910-15 area, or the highest level since August 8 touched in reaction to the softer US CPI report.
Looking at the technical picture, the GBP/USD pair showed some resilience below the 1.3800 mark and attracted fresh buying in the vicinity of the lower end of an ascending trend channel. The mentioned support, currently around the 1.3780 region, should now act as a key pivotal point for short-term traders and help determine the next leg of a directional move.
Meanwhile, technical indicators on the daily chat are holding with a mild bullish bias and have again started gaining positive traction on hourly charts. The set-up supports prospects for an extension of the intraday move back towards the 1.3885-90 supply zone. A subsequent strength beyond the 1.3900 mark and the overnight swing highs will be seen as a fresh trigger for bullish traders and allow the GBP/USD pair to aim back to reclaim the 1.4000 psychological mark.
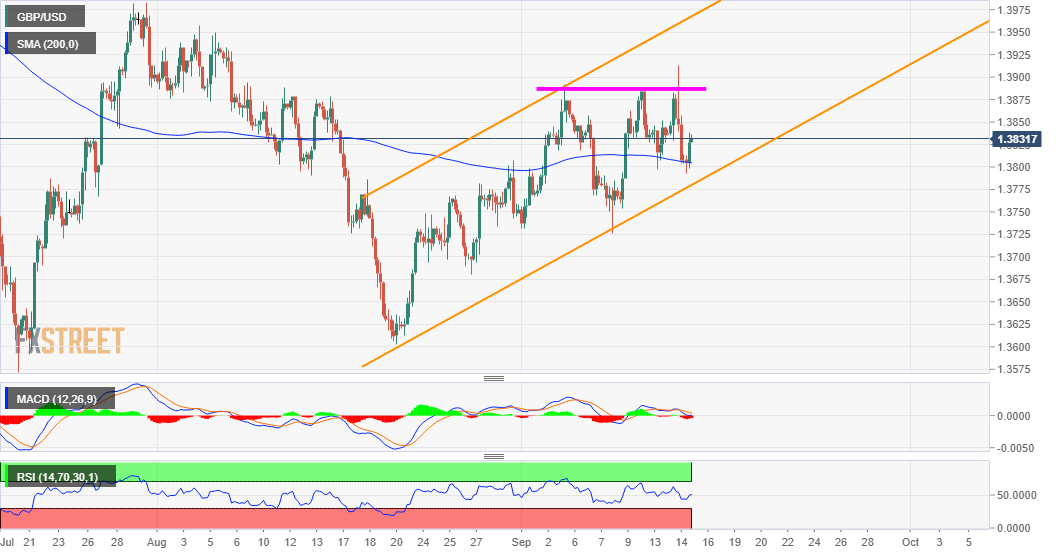
On the flip side, the 1.3800 mark, coinciding with 200-period SMA on the 4-hour chart now seems to protect the immediate downside. This is followed by the mentioned ascending channel support, which if broken will negate any near-term positive bias and prompt aggressive technical selling. The GBP/USD pair might then accelerate the slide towards testing intermediate support near the 1.3730-25 region before eventually dropping to the 1.3700 mark.
GBP/USD 4-hour chart