- GBP/USD staged a modest bounce from two-week lows, though lacked any follow-through.
- Descending triangle support break and the formation of double-top favours bearish traders.
- Sustained weakness below the 1.3835 support area will reaffirm the near-term negative bias.
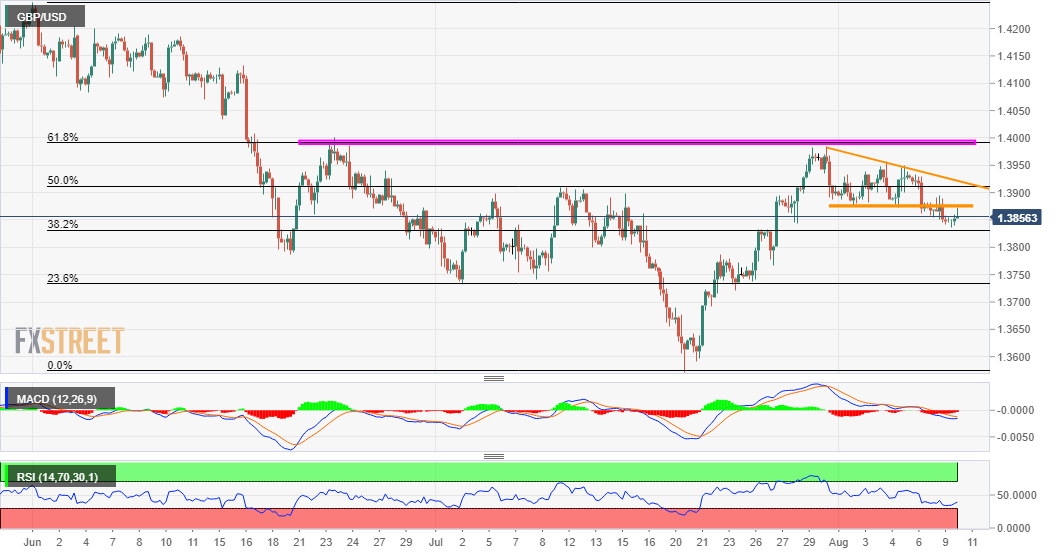
The GBP/USD pair found some support near the 38.2% Fibonacci level of the 1.4249-1.3572 downfall and staged a modest bounce from two-week lows, around the 1.3835 region touched earlier this Tuesday.
The uptick lacked any obvious fundamental catalyst and remained capped near the 1.3870 horizontal support breakpoint. The mentioned level, along with a downward sloping trend-line resistance constituted the formation of a descending triangle on short-term charts.
Apart from this, the recent pullback from the vicinity of the 1.4000 psychological mark formed a bearish double-top on the daily chart. The combination of bearish patterns suggests that the recent strong rebound from the lowest level since early February has run out of steam.
Hence, any subsequent move up beyond the mentioned horizontal support breakpoint might still be seen as a selling opportunity near the 1.3900 mark. This should cap the GBP/USD pair near the 1.3910-15 confluence hurdle, comprising of 50% Fibo. level and the 100-day SMA.
On the flip side, some follow-through selling below the 1.3835 region (38.2% Fibo. level) will reaffirm the bearish bias turn the GBP/USD pair vulnerable to break below the 1.3800 mark. The downward trajectory could then get extended towards the 23.6% Fibo., around the 1.3730-25 area.
GBP/USD 4-hour chart


